1
Brooklyn Community Board 1
About This District
Brooklyn Community District 1
Brooklyn Community District 1 encompasses Greenpoint and Williamsburg. Covering 4.7 square miles and home to more than 200,000 residents, it sits on the borough's northern edge, where the East River, Newtown Creek, and the Queens line shape the district.
Greenpoint and Williamsburg give the district a mix of waterfront industry, older rowhouse blocks, large apartment development, nightlife, manufacturing, public housing, and ongoing redevelopment along the waterfront and near transit.
Brooklyn Community Board 1 — Interactive District Map
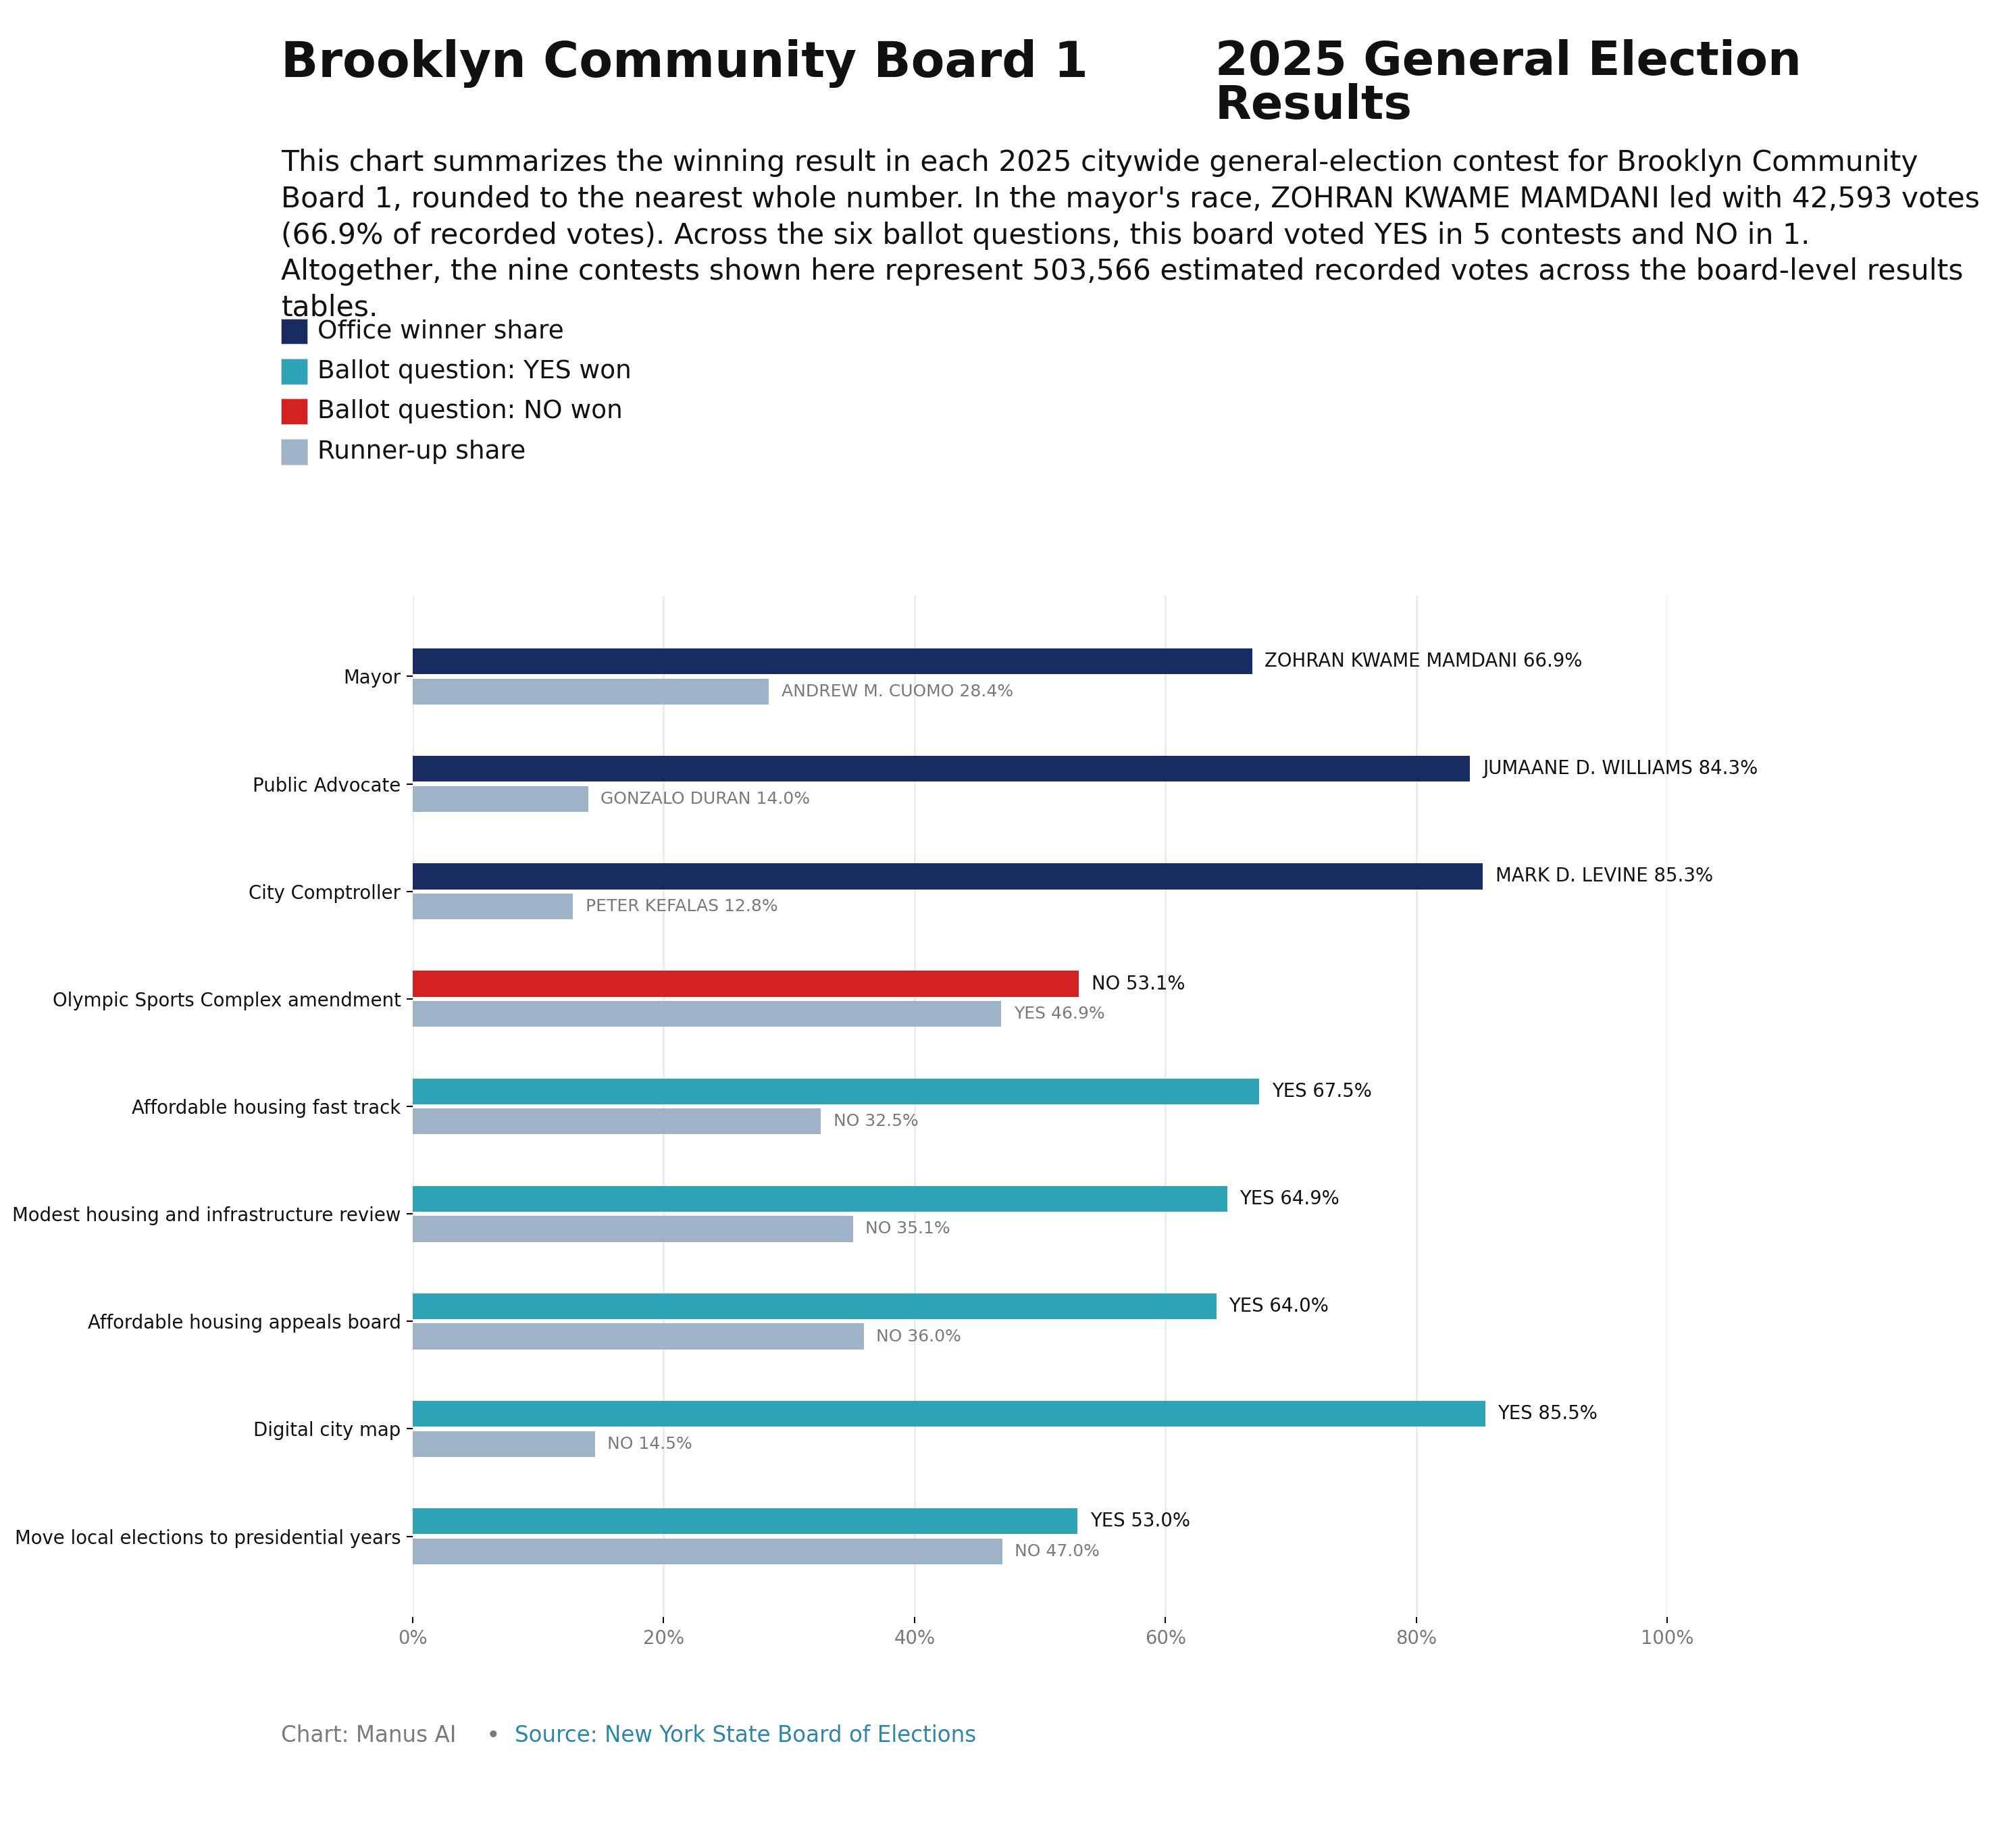
Open full map ↗2025 General Election Results
2025 NOVEMBER GENERAL ELECTION
BKCB1
BKCB1 — Mamdani won this CB district 67.7% to 28.7% for Cuomo and 3.6% for Sliwa, and carried 81 of 100 election districts here.
Mamdani won 81 of 100 election districts in BKCB1.
Winner
Mamdani by 39.0%
EDs carried
Mamdani: 81 of 100
Mamdani
67.7%
Cuomo
28.7%
Sliwa 3.6%
Mayor
43,720 total votes
2025 General Election Results
Mayor
43,720 total votes
Q1 — Olympic Sports Complex
Citywide: NO 45/59 (76%) · YES 14/59 (24%)
Q2 — Fast Track Affordable Housing
38,883 votes cast
Q3 — Simplify Housing & Infrastructure Review
38,289 votes cast
Q4 — Affordable Housing Appeals Board
37,638 votes cast
Q5 — Digital City Map
Citywide: YES 55/59 (93%) · NO 4/59 (7%)
Q6 — Move Local Elections to Presidential Years
Citywide: NO 31/59 (53%) · YES 28/59 (47%)
Brooklyn CB1 — 2025 General Election Results
Community Health Profile
Greenpoint and Williamsburg · Source: NYC DOHMH 2026 Community Health Profiles
Demographics
Total Population
201,467
Boro #3
NYC #7
Age 0–17
23.0%
Boro #5
NYC #14
Age 18–24
9.1%
Boro #5
NYC #22
Age 25–44
39.8%
Boro #3
NYC #7
Age 45–64
16.6%
Boro #18
NYC #59
Age 65+
11.5%
Boro #18
NYC #57
Asian
6.3%
Boro #11
NYC #41
Black
4.5%
Boro #13
NYC #42
Latino
26.6%
Boro #4
NYC #25
White
60.6%
Boro #4
NYC #11
Other race/ethnicity
1.9%
Boro #13
NYC #35
Limited English Proficiency
18.7%
Boro #9
NYC #32
Born Outside the US
21.5%
Boro #15
NYC #55
Education
Elementary School Absenteeism
34.2%
Boro #7
NYC #25
On-Time High School Graduation
84.0%
Boro #9
NYC #34
Did Not Complete High School
14.1%
Boro #9
NYC #26
High School Grad / Some College
27.2%
Boro #15
NYC #47
College Degree or Higher
58.7%
Boro #3
NYC #11
Economy
Poverty
18.2%
Boro #7
NYC #32
Unemployment
7.5%
Boro #10
NYC #33
Rent Burden
42.0%
Boro #3
NYC #9
Helpful Neighbors
60.3%
Boro #10
NYC #23
Jail Incarceration
136.4
Boro #7
NYC #25
Environment & Housing
Air Conditioning
93.4%
Boro #3
NYC #19
Air Pollution
7.4
Boro #18
NYC #53
Renter Housing Problems
59.0%
Boro #6
NYC #23
Homes Reporting Cockroaches
21.8%
Boro #4
NYC #17
Bodega:Supermarket Ratio
11.3
Boro #8
NYC #43
Farmers Markets
4
Boro #3
NYC #9
Bike Network Coverage
27.8%
Boro #6
NYC #22
Non-Fatal Assault Hospitalizations
26.9
Boro #7
NYC #17
Maternal & Child Health
Late or No Prenatal Care
3.8%
Boro #4
NYC #12
Preterm Births
5.6%
Boro #1
NYC #1
Teen Births
8.3%
Boro #8
NYC #28
Childhood Obesity
19.7%
Boro #7
NYC #21
Child Asthma ED Visits
74.3
Boro #5
NYC #14
Health Behaviors
Self-Reported Good Health
86.4%
Boro #3
NYC #15
Physical Activity
71.2%
Boro #5
NYC #22
Sugary Drink Consumption
8.5%
Boro #2
NYC #10
Fruit and Vegetable Consumption
91.5%
Boro #6
NYC #16
Current Smokers
4.9%
Boro #4
NYC #12
Binge Drinking
34.9%
Boro #16
NYC #56
Obesity
13.5%
Boro #1
NYC #5
Healthcare Access
Uninsured
7.8%
Boro #5
NYC #18
Unmet Medical Care
13.8%
Boro #6
NYC #23
Flu Vaccination
45.0%
Boro #8
NYC #40
HPV Vaccination
15.6%
Boro #18
NYC #58
Disease & Mortality
Avoidable Hospitalizations
756.7
Boro #7
NYC #22
Fall Hospitalizations
1132.5
Boro #8
NYC #13
Diabetes
9.5%
Boro #4
NYC #14
Hypertension
21.6%
Boro #3
NYC #6
New HIV Diagnoses
9.2
Boro #4
NYC #15
New Hepatitis C Reports
20.3
Boro #3
NYC #17
Psychiatric Hospitalizations
268.8
Boro #1
NYC #8
Infant Mortality
2.1
Boro #5
NYC #13
Premature Mortality Number
1,146
Boro #9
NYC #23
Premature Mortality Rate
156.1
Boro #8
NYC #22
Life Expectancy
84.4 years
Boro #5
NYC #21
▼ Full data table (all 58 indicators)
| Indicator | Value | Boro Rank | NYC Rank | Rank |
|---|---|---|---|---|
| Total Population | 201,467 | #3 of 18 | #7 of 59 | ↑ #3 |
| Age 0–17 | 23.0% | #5 of 18 | #14 of 59 | ↑ #5 |
| Age 18–24 | 9.1% | #5 of 18 | #22 of 59 | ↑ #5 |
| Age 25–44 | 39.8% | #3 of 18 | #7 of 59 | ↑ #3 |
| Age 45–64 | 16.6% | #18 of 18 | #59 of 59 | ↑ #18 |
| Age 65+ | 11.5% | #18 of 18 | #57 of 59 | ↑ #18 |
| Asian | 6.3% | #11 of 18 | #41 of 59 | ↑ #11 |
| Black | 4.5% | #13 of 18 | #42 of 59 | ↑ #13 |
| Latino | 26.6% | #4 of 18 | #25 of 59 | ↑ #4 |
| White | 60.6% | #4 of 18 | #11 of 59 | ↑ #4 |
| Other race/ethnicity | 1.9% | #13 of 18 | #35 of 59 | ↑ #13 |
| Limited English Proficiency | 18.7% | #9 of 18 | #32 of 59 | ↑ #9 |
| Born Outside the US | 21.5% | #15 of 18 | #55 of 59 | ↑ #15 |
| Elementary School Absenteeism | 34.2% | #7 of 18 | #25 of 59 | ↓ #7 |
| On-Time High School Graduation | 84.0% | #9 of 18 | #34 of 59 | ↑ #9 |
| Did Not Complete High School | 14.1% | #9 of 18 | #26 of 59 | ↓ #9 |
| High School Grad / Some College | 27.2% | #15 of 18 | #47 of 59 | ↑ #15 |
| College Degree or Higher | 58.7% | #3 of 18 | #11 of 59 | ↑ #3 |
| Poverty | 18.2% | #7 of 18 | #32 of 59 | ↓ #7 |
| Unemployment | 7.5% | #10 of 18 | #33 of 59 | ↓ #10 |
| Rent Burden | 42.0% | #3 of 18 | #9 of 59 | ↓ #3 |
| Avertable Deaths | 17.8 | #4 of 18 | #14 of 59 | ↓ #4 |
| Helpful Neighbors | 60.3% | #10 of 18 | #23 of 59 | ↑ #10 |
| Non-Fatal Assault Hospitalizations | 26.9 | #7 of 18 | #17 of 59 | ↓ #7 |
| Jail Incarceration | 136.4 | #7 of 18 | #25 of 59 | ↓ #7 |
| Air Conditioning | 93.4% | #3 of 18 | #19 of 59 | ↑ #3 |
| Air Pollution | 7.4 | #18 of 18 | #53 of 59 | ↓ #18 |
| Renter Homes with Health-Related Housing Problems | 59.0% | #6 of 18 | #23 of 59 | ↓ #6 |
| Homes Reporting Cockroaches | 21.8% | #4 of 18 | #17 of 59 | ↓ #4 |
| Ratio of Bodegas to Supermarkets | 11.3 | #8 of 18 | #43 of 59 | ↓ #8 |
| Farmers Markets | 4 | #3 of 18 | #9 of 59 | ↑ #3 |
| Bicycle Network Coverage | 27.8% | #6 of 18 | #22 of 59 | ↑ #6 |
| Pedestrian Injury Hospitalizations | 11.8 | #4 of 18 | #16 of 59 | ↓ #4 |
| Late or No Prenatal Care | 3.8% | #4 of 18 | #12 of 59 | ↓ #4 |
| Preterm Births | 5.6% | #1 of 18 | #1 of 59 | ↓ #1 |
| Teen Births | 8.3% | #8 of 18 | #28 of 59 | ↓ #8 |
| Childhood Obesity | 19.7% | #7 of 18 | #21 of 59 | ↓ #7 |
| Child Asthma Emergency Department Visits | 74.3 | #5 of 18 | #14 of 59 | ↓ #5 |
| Self-Reported Good Health | 86.4% | #3 of 18 | #15 of 59 | ↑ #3 |
| Physical Activity | 71.2% | #5 of 18 | #22 of 59 | ↑ #5 |
| Sugary Drink Consumption | 8.5% | #2 of 18 | #10 of 59 | ↓ #2 |
| Fruit and Vegetable Consumption | 91.5% | #6 of 18 | #16 of 59 | ↑ #6 |
| Current Smokers | 4.9% | #4 of 18 | #12 of 59 | ↓ #4 |
| Uninsured | 7.8% | #5 of 18 | #18 of 59 | ↓ #5 |
| Unmet Medical Care | 13.8% | #6 of 18 | #23 of 59 | ↓ #6 |
| Avoidable Hospitalizations Among Adults | 756.7 | #7 of 18 | #22 of 59 | ↓ #7 |
| Fall-Related Hospitalizations Among Older Adults | 1132.5 | #8 of 18 | #13 of 59 | ↓ #8 |
| Flu Vaccination | 45.0% | #8 of 18 | #40 of 59 | ↑ #8 |
| HPV Vaccination | 15.6% | #18 of 18 | #58 of 59 | ↑ #18 |
| Obesity | 13.5% | #1 of 18 | #5 of 59 | ↓ #1 |
| Diabetes | 9.5% | #4 of 18 | #14 of 59 | ↓ #4 |
| Hypertension | 21.6% | #3 of 18 | #6 of 59 | ↓ #3 |
| New HIV Diagnoses | 9.2 | #4 of 18 | #15 of 59 | ↓ #4 |
| New Hepatitis C Reports | 20.3 | #3 of 18 | #17 of 59 | ↓ #3 |
| Binge Drinking | 34.9% | #16 of 18 | #56 of 59 | ↓ #16 |
| Psychiatric Hospitalizations | 268.8 | #1 of 18 | #8 of 59 | ↓ #1 |
| Infant Mortality | 2.1 | #5 of 18 | #13 of 59 | ↓ #5 |
| Premature Mortality Number | 1,146 | #9 of 18 | #23 of 59 | ↓ #9 |
| Premature Mortality Rate | 156.1 | #8 of 18 | #22 of 59 | ↓ #8 |
| Life Expectancy | 84.4 years | #5 of 18 | #21 of 59 | ↑ #5 |
District Representatives
NYC Council
Congress — House

State Assembly


State Senate
BK-Wide · NYC-Wide · NYS-Wide