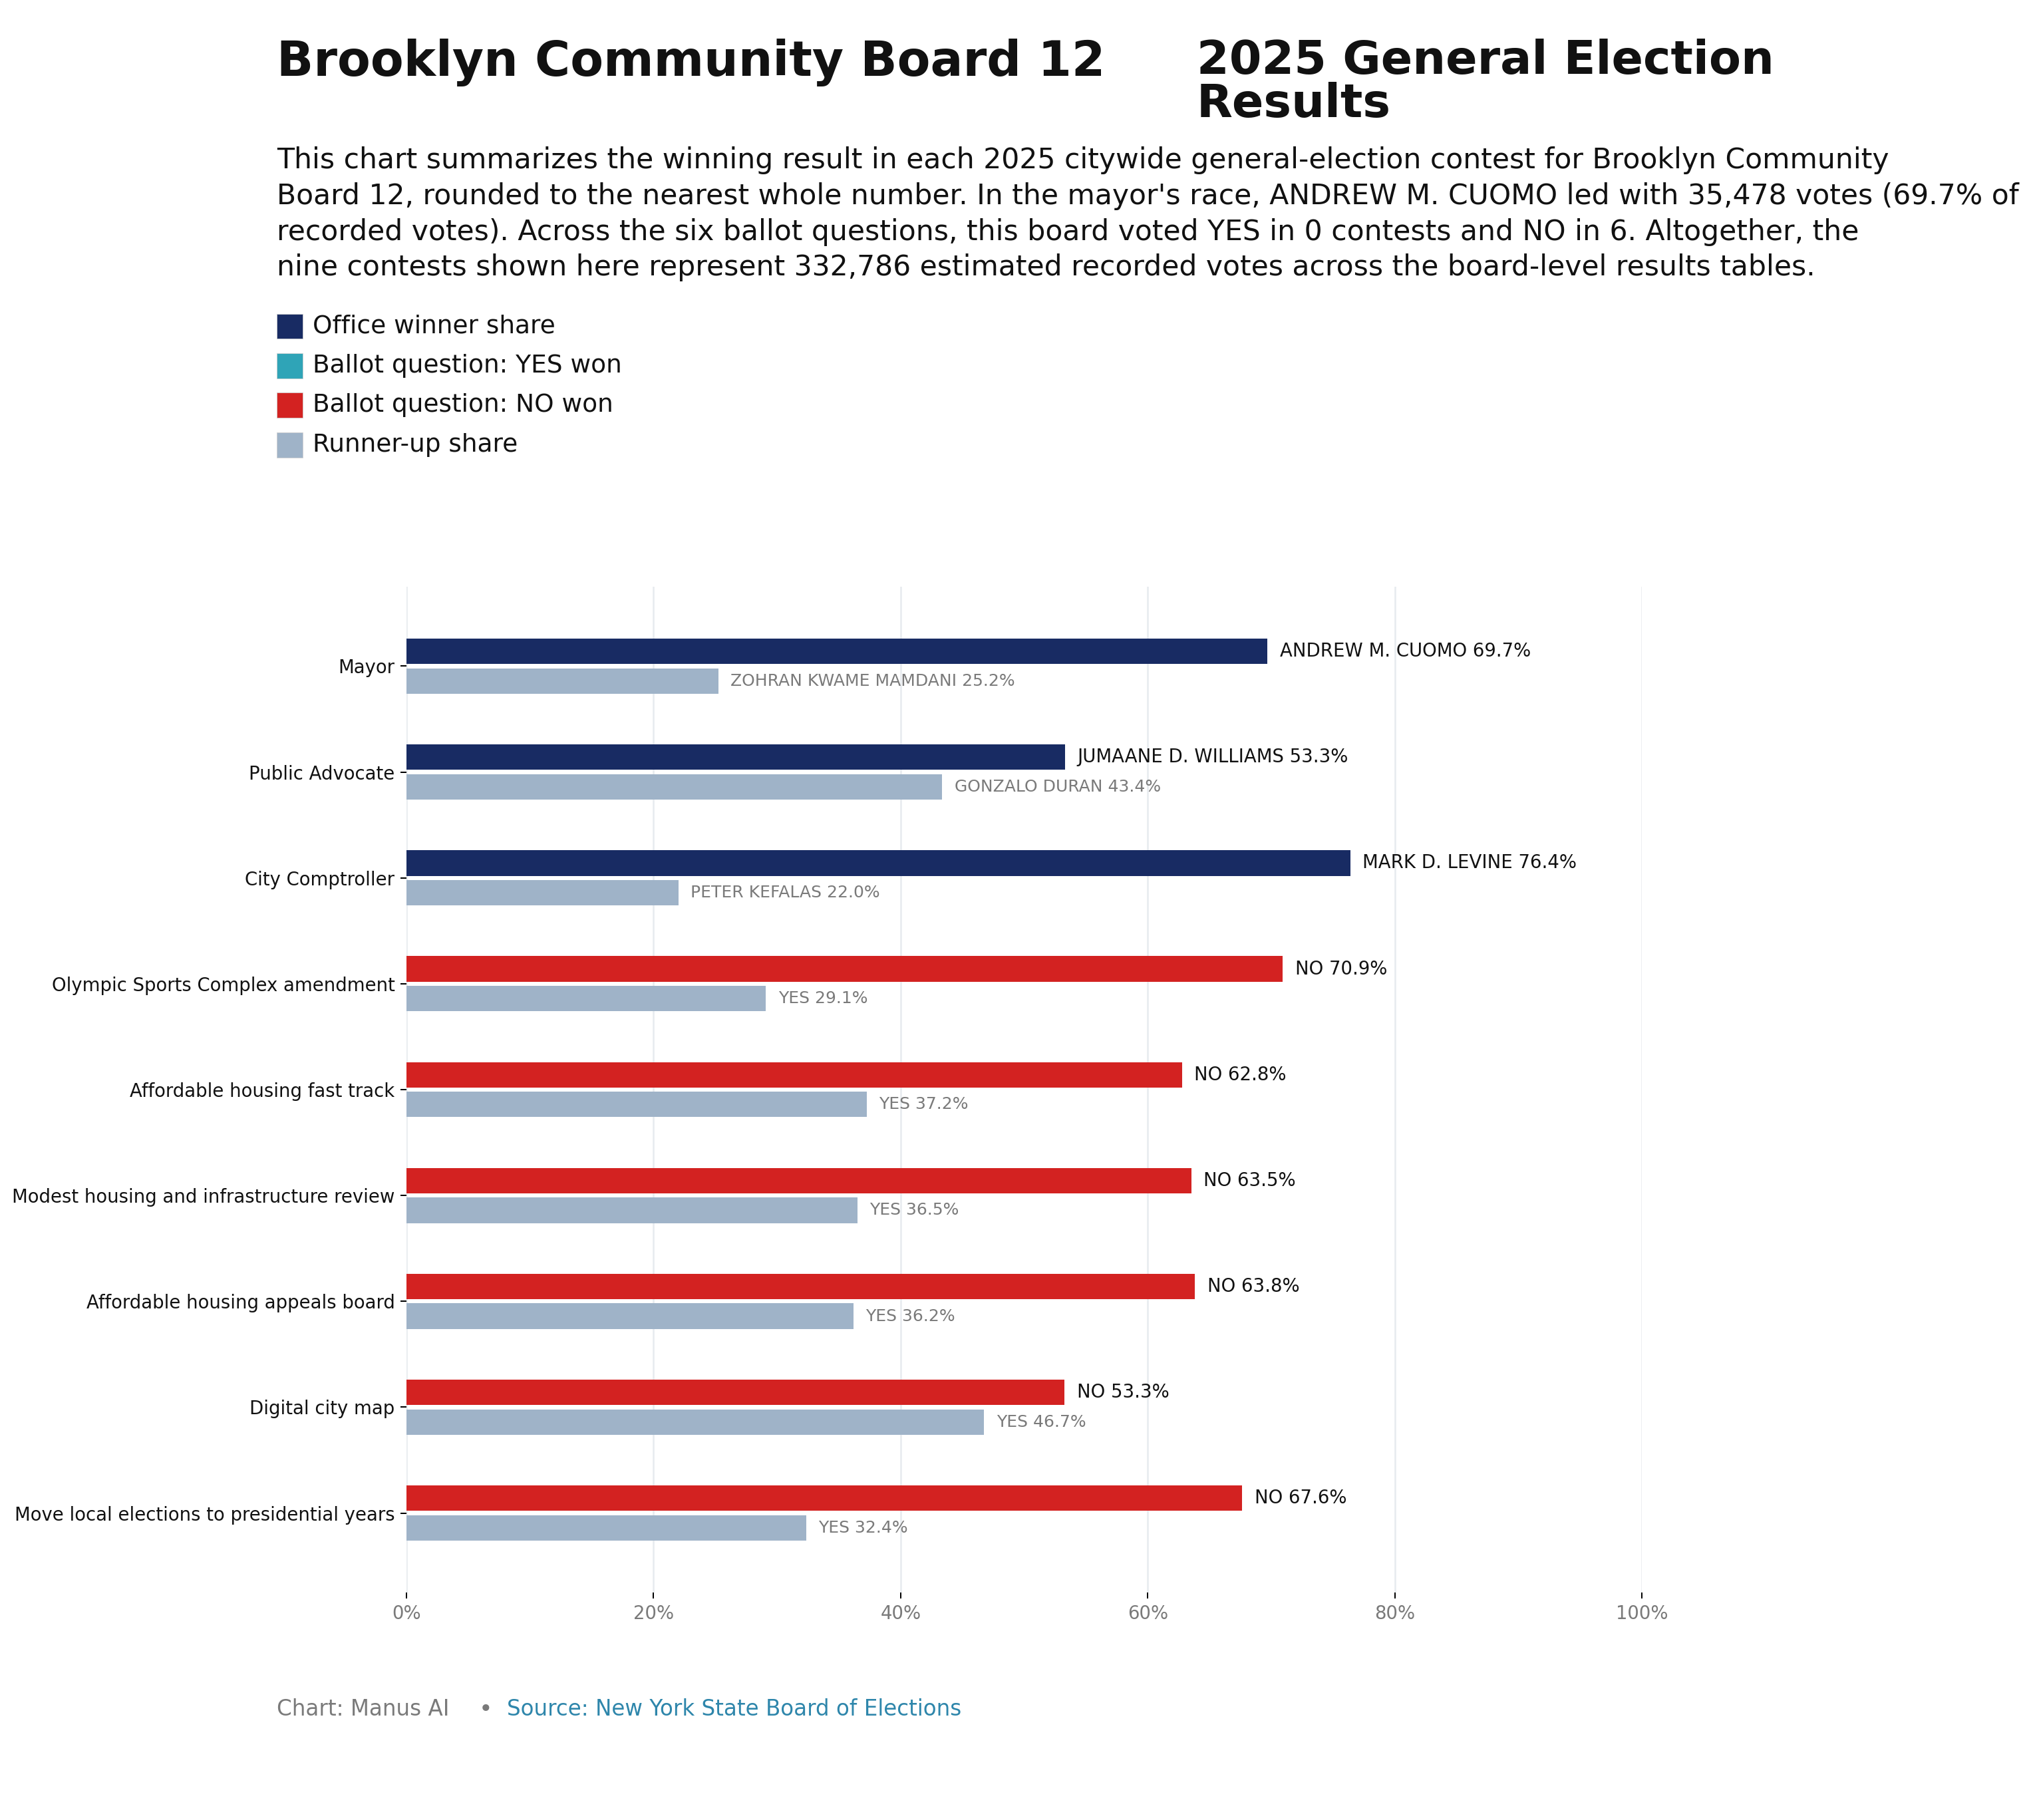
2025 General Election Results
2025 NOVEMBER GENERAL ELECTION
BKCB12
BKCB12 — Cuomo won this CB district 27.6% to 68.6% for Cuomo and 3.8% for Sliwa, and carried 59 of 86 election districts here.
Cuomo won 59 of 86 election districts in BKCB12.
Winner
Cuomo by 41.0%
EDs carried
Cuomo: 59 of 86
Mamdani
27.6%
Cuomo
68.6%
Sliwa 3.8%
Mayor
66,903 votes cast
Q1 — Olympic Sports Complex
Citywide: NO 45/59 (76%) · YES 14/59 (24%)
Q2 — Fast Track Affordable Housing
51,149 votes cast
Q3 — Simplify Housing & Infrastructure Review
50,607 votes cast
Q4 — Affordable Housing Appeals Board
49,361 votes cast
Q5 — Digital City Map
Citywide: YES 55/59 (93%) · NO 4/59 (7%)
Q6 — Move Local Elections to Presidential Years
Citywide: NO 31/59 (53%) · YES 28/59 (47%)
Brooklyn CB12 — 2025 General Election Results