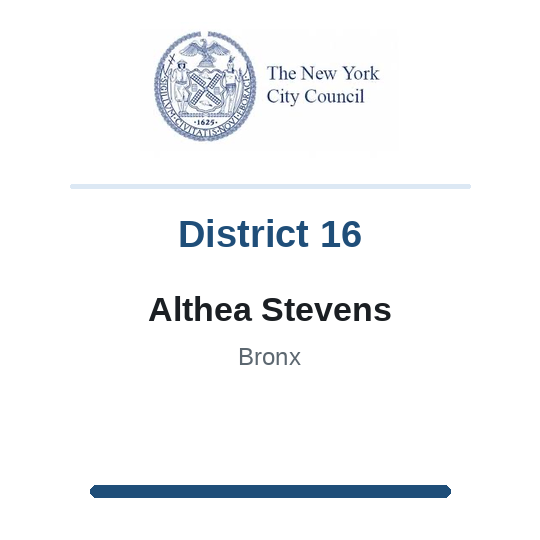
4
Bronx Community Board 4
About This District
The Bronx Community District 4
The Bronx Community District 4 encompasses Concourse, Concourse Village, and Highbridge. Covering 2.04 square miles and home to more than 140,000 residents, it sits in the west-central Bronx near Yankee Stadium and the Grand Concourse.
The district sits near Yankee Stadium and the Grand Concourse, with dense apartment buildings, public housing, parks, institutions, and heavy transit use. It is one of the borough's most urban community districts.
Bronx Community Board 4 — Interactive District Map
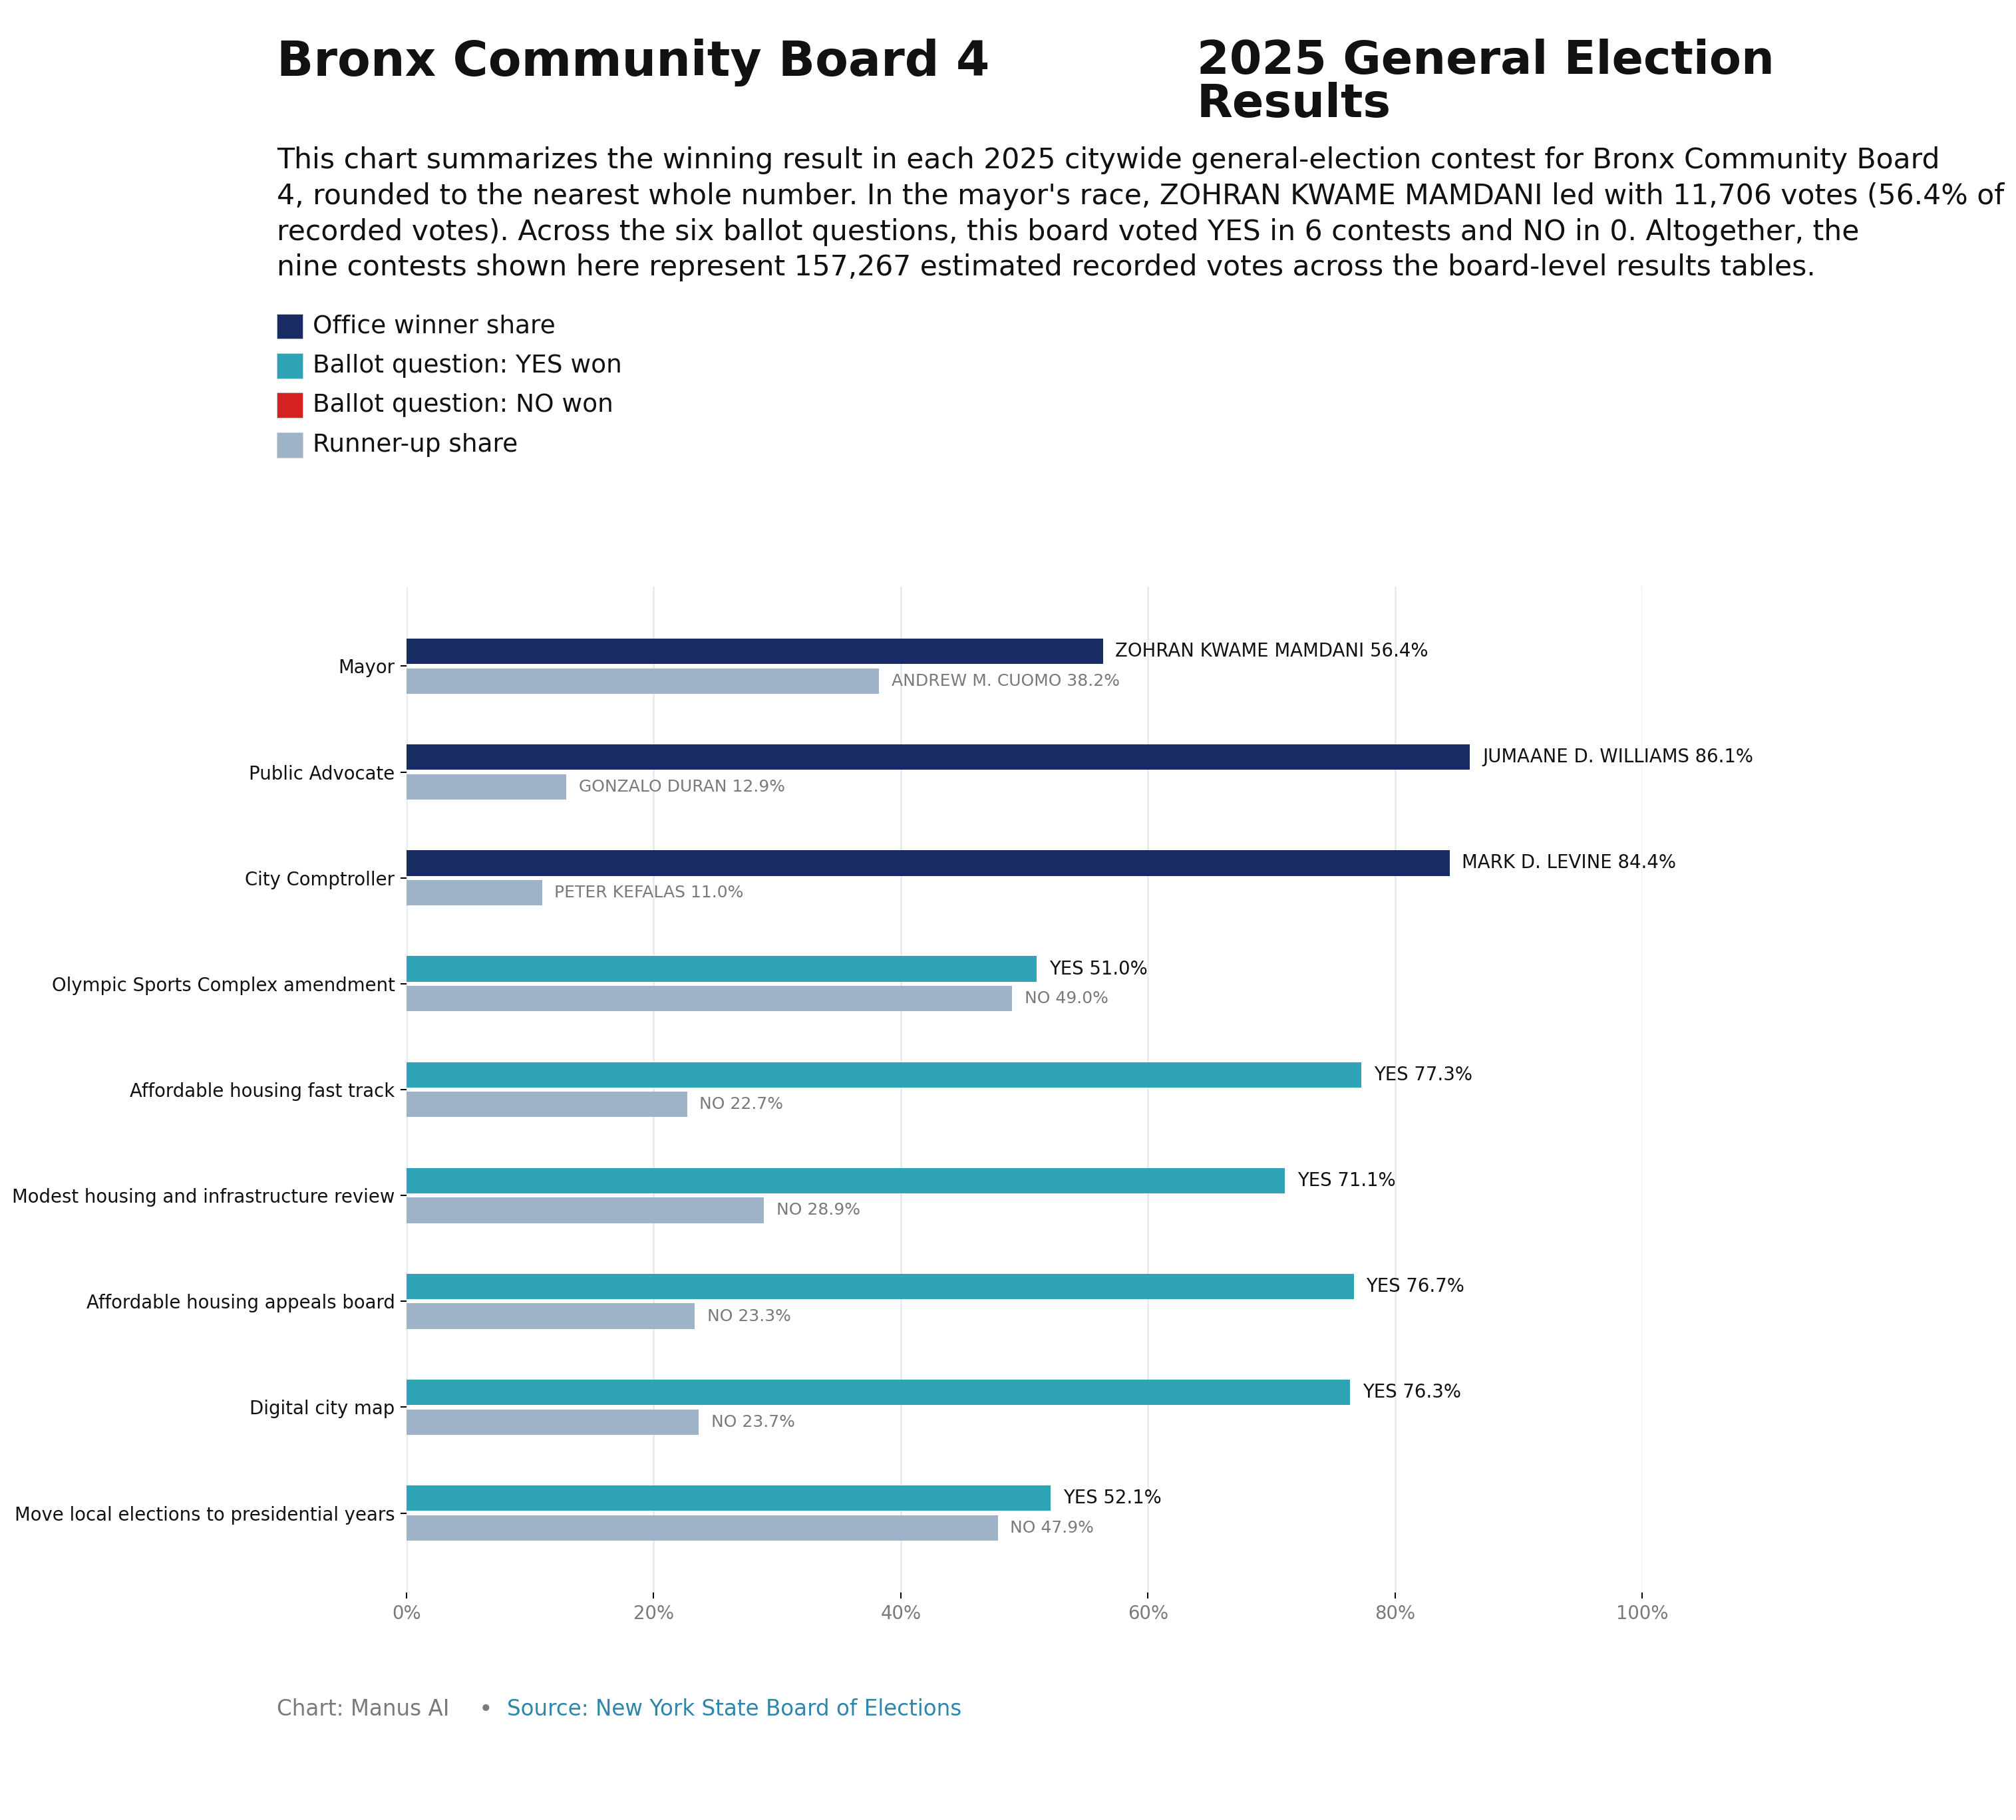
Open full map ↗2025 General Election Results
2025 NOVEMBER GENERAL ELECTION
BXCB4
BXCB4 — Mamdani won this CB district 56.8% to 38.9% for Cuomo and 4.2% for Sliwa, and carried 58 of 61 election districts here.
Mamdani won 58 of 61 election districts in BXCB4.
Winner
Mamdani by 17.9%
EDs carried
Mamdani: 58 of 61
Mamdani
56.8%
Cuomo
38.9%
Sliwa 4.2%
Mayor
Citywide: Mamdani 39/59 (66%) · Cuomo 20/59 (34%)
Q1 — Olympic Sports Complex
Citywide: NO 45/59 (76%) · YES 14/59 (24%)
Q2 — Fast Track Affordable Housing
Citywide: YES 46/59 (78%) · NO 13/59 (22%)
Q3 — Simplify Housing & Infrastructure Review
Citywide: YES 45/59 (76%) · NO 14/59 (24%)
Q4 — Affordable Housing Appeals Board
Citywide: YES 47/59 (80%) · NO 12/59 (20%)
Q5 — Digital City Map
Citywide: YES 55/59 (93%) · NO 4/59 (7%)
Q6 — Move Local Elections to Presidential Years
Citywide: NO 31/59 (53%) · YES 28/59 (47%)
Bronx CB4 — 2025 General Election Results
Community Health Profile
Highbridge and Concourse · Source: NYC DOHMH 2026 Community Health Profiles
Demographics
Total Population
148,588
Boro #3
NYC #25
Age 0–17
25.3%
Boro #6
NYC #7
Age 18–24
9.7%
Boro #7
NYC #14
Age 25–44
28.0%
Boro #5
NYC #35
Age 45–64
23.3%
Boro #8
NYC #38
Age 65+
13.7%
Boro #8
NYC #48
Asian
2.2%
Boro #7
NYC #51
Black
31.7%
Boro #3
NYC #15
Latino
63.7%
Boro #6
NYC #8
White
1.2%
Boro #9
NYC #55
Other race/ethnicity
1.2%
Boro #7
NYC #53
Limited English Proficiency
31.3%
Boro #3
NYC #11
Born Outside the US
37.5%
Boro #4
NYC #25
Education
Elementary School Absenteeism
40.8%
Boro #8
NYC #45
On-Time High School Graduation
79.2%
Boro #8
NYC #53
Did Not Complete High School
28.2%
Boro #6
NYC #52
High School Grad / Some College
46.6%
Boro #4
NYC #9
College Degree or Higher
25.2%
Boro #7
NYC #53
Economy
Poverty
26.9%
Boro #9
NYC #55
Unemployment
11.2%
Boro #6
NYC #51
Rent Burden
57.0%
Boro #6
NYC #52
Helpful Neighbors
51.2%
Boro #6
NYC #46
Jail Incarceration
321.4
Boro #7
NYC #49
Environment & Housing
Air Conditioning
84.6%
Boro #6
NYC #49
Air Pollution
6.9
Boro #6
NYC #36
Renter Housing Problems
82.0%
Boro #7
NYC #51
Homes Reporting Cockroaches
61.0%
Boro #11
NYC #55
Bodega:Supermarket Ratio
8.9
Boro #7
NYC #34
Farmers Markets
6
Boro #1
NYC #2
Bike Network Coverage
21.2%
Boro #10
NYC #32
Non-Fatal Assault Hospitalizations
78.7
Boro #7
NYC #47
Maternal & Child Health
Late or No Prenatal Care
13.8%
Boro #8
NYC #54
Preterm Births
9.9%
Boro #2
NYC #30
Teen Births
15.7%
Boro #8
NYC #51
Childhood Obesity
27.9%
Boro #6
NYC #53
Child Asthma ED Visits
262.3
Boro #9
NYC #52
Health Behaviors
Self-Reported Good Health
66.5%
Boro #12
NYC #59
Physical Activity
66.8%
Boro #3
NYC #35
Sugary Drink Consumption
18.8%
Boro #3
NYC #46
Fruit and Vegetable Consumption
74.2%
Boro #12
NYC #59
Current Smokers
6.1%
Boro #1
NYC #18
Binge Drinking
24.4%
Boro #8
NYC #31
Obesity
41.6%
Boro #9
NYC #56
Healthcare Access
Uninsured
8.5%
Boro #4
NYC #19
Unmet Medical Care
12.0%
Boro #2
NYC #9
Flu Vaccination
52.1%
Boro #1
NYC #16
HPV Vaccination
64.2%
Boro #7
NYC #12
Disease & Mortality
Avoidable Hospitalizations
1717.0
Boro #8
NYC #51
Fall Hospitalizations
1143.0
Boro #2
NYC #19
Diabetes
17.6%
Boro #6
NYC #50
Hypertension
41.3%
Boro #12
NYC #59
New HIV Diagnoses
28.2
Boro #7
NYC #51
New Hepatitis C Reports
39.7
Boro #7
NYC #46
Psychiatric Hospitalizations
690.1
Boro #8
NYC #49
Infant Mortality
5.8
Boro #7
NYC #50
Premature Mortality Number
2,031
Boro #11
NYC #55
Premature Mortality Rate
292.9
Boro #7
NYC #48
Life Expectancy
79.9 years
Boro #6
NYC #48
▼ Full data table (all 58 indicators)
| Indicator | Value | Boro Rank | NYC Rank | Rank |
|---|---|---|---|---|
| Total Population | 148,588 | #3 of 12 | #25 of 59 | ↑ #3 |
| Age 0–17 | 25.3% | #6 of 12 | #7 of 59 | ↑ #6 |
| Age 18–24 | 9.7% | #7 of 12 | #14 of 59 | ↑ #7 |
| Age 25–44 | 28.0% | #5 of 12 | #35 of 59 | ↑ #5 |
| Age 45–64 | 23.3% | #8 of 12 | #38 of 59 | ↑ #8 |
| Age 65+ | 13.7% | #8 of 12 | #48 of 59 | ↑ #8 |
| Asian | 2.2% | #7 of 12 | #51 of 59 | ↑ #7 |
| Black | 31.7% | #3 of 12 | #15 of 59 | ↑ #3 |
| Latino | 63.7% | #6 of 12 | #8 of 59 | ↑ #6 |
| White | 1.2% | #9 of 12 | #55 of 59 | ↑ #9 |
| Other race/ethnicity | 1.2% | #7 of 12 | #53 of 59 | ↑ #7 |
| Limited English Proficiency | 31.3% | #3 of 12 | #11 of 59 | ↑ #3 |
| Born Outside the US | 37.5% | #4 of 12 | #25 of 59 | ↑ #4 |
| Elementary School Absenteeism | 40.8% | #8 of 12 | #45 of 59 | ↓ #8 |
| On-Time High School Graduation | 79.2% | #8 of 12 | #53 of 59 | ↑ #8 |
| Did Not Complete High School | 28.2% | #6 of 12 | #52 of 59 | ↓ #6 |
| High School Grad / Some College | 46.6% | #4 of 12 | #9 of 59 | ↑ #4 |
| College Degree or Higher | 25.2% | #7 of 12 | #53 of 59 | ↑ #7 |
| Poverty | 26.9% | #9 of 12 | #55 of 59 | ↓ #9 |
| Unemployment | 11.2% | #6 of 12 | #51 of 59 | ↓ #6 |
| Rent Burden | 57.0% | #6 of 12 | #52 of 59 | ↓ #6 |
| Avertable Deaths | 48.2 | #6 of 12 | #43 of 59 | ↓ #6 |
| Helpful Neighbors | 51.2% | #6 of 12 | #46 of 59 | ↑ #6 |
| Non-Fatal Assault Hospitalizations | 78.7 | #7 of 12 | #47 of 59 | ↓ #7 |
| Jail Incarceration | 321.4 | #7 of 12 | #49 of 59 | ↓ #7 |
| Air Conditioning | 84.6% | #6 of 12 | #49 of 59 | ↑ #6 |
| Air Pollution | 6.9 | #6 of 12 | #36 of 59 | ↓ #6 |
| Renter Homes with Health-Related Housing Problems | 82.0% | #7 of 12 | #51 of 59 | ↓ #7 |
| Homes Reporting Cockroaches | 61.0% | #11 of 12 | #55 of 59 | ↓ #11 |
| Ratio of Bodegas to Supermarkets | 8.9 | #7 of 12 | #34 of 59 | ↓ #7 |
| Farmers Markets | 6 | #1 of 12 | #2 of 59 | ↑ #1 |
| Bicycle Network Coverage | 21.2% | #10 of 12 | #32 of 59 | ↑ #10 |
| Pedestrian Injury Hospitalizations | 25.0 | #9 of 12 | #50 of 59 | ↓ #9 |
| Late or No Prenatal Care | 13.8% | #8 of 12 | #54 of 59 | ↓ #8 |
| Preterm Births | 9.9% | #2 of 12 | #30 of 59 | ↓ #2 |
| Teen Births | 15.7% | #8 of 12 | #51 of 59 | ↓ #8 |
| Childhood Obesity | 27.9% | #6 of 12 | #53 of 59 | ↓ #6 |
| Child Asthma Emergency Department Visits | 262.3 | #9 of 12 | #52 of 59 | ↓ #9 |
| Self-Reported Good Health | 66.5% | #12 of 12 | #59 of 59 | ↑ #12 |
| Physical Activity | 66.8% | #3 of 12 | #35 of 59 | ↑ #3 |
| Sugary Drink Consumption | 18.8% | #3 of 12 | #46 of 59 | ↓ #3 |
| Fruit and Vegetable Consumption | 74.2% | #12 of 12 | #59 of 59 | ↑ #12 |
| Current Smokers | 6.1% | #1 of 12 | #18 of 59 | ↓ #1 |
| Uninsured | 8.5% | #4 of 12 | #19 of 59 | ↓ #4 |
| Unmet Medical Care | 12.0% | #2 of 12 | #9 of 59 | ↓ #2 |
| Avoidable Hospitalizations Among Adults | 1717.0 | #8 of 12 | #51 of 59 | ↓ #8 |
| Fall-Related Hospitalizations Among Older Adults | 1143.0 | #2 of 12 | #19 of 59 | ↓ #2 |
| Flu Vaccination | 52.1% | #1 of 12 | #16 of 59 | ↑ #1 |
| HPV Vaccination | 64.2% | #7 of 12 | #12 of 59 | ↑ #7 |
| Obesity | 41.6% | #9 of 12 | #56 of 59 | ↓ #9 |
| Diabetes | 17.6% | #6 of 12 | #50 of 59 | ↓ #6 |
| Hypertension | 41.3% | #12 of 12 | #59 of 59 | ↓ #12 |
| New HIV Diagnoses | 28.2 | #7 of 12 | #51 of 59 | ↓ #7 |
| New Hepatitis C Reports | 39.7 | #7 of 12 | #46 of 59 | ↓ #7 |
| Binge Drinking | 24.4% | #8 of 12 | #31 of 59 | ↓ #8 |
| Psychiatric Hospitalizations | 690.1 | #8 of 12 | #49 of 59 | ↓ #8 |
| Infant Mortality | 5.8 | #7 of 12 | #50 of 59 | ↓ #7 |
| Premature Mortality Number | 2,031 | #11 of 12 | #55 of 59 | ↓ #11 |
| Premature Mortality Rate | 292.9 | #7 of 12 | #48 of 59 | ↓ #7 |
| Life Expectancy | 79.9 years | #6 of 12 | #48 of 59 | ↑ #6 |