Queens Community Board 1
Queens Community District 1
Queens Community District 1 encompasses Astoria, Ditmars, Long Island City, Queensbridge, Ravenswood, Rikers Island, Steinway, and Woodside. Covering 6.2 square miles and home to more than 170,000 residents, it covers northwest Queens along the East River.
Astoria, Ditmars, Long Island City, Queensbridge, Ravenswood, Steinway, Woodside, and Rikers Island give the district a mix of waterfront industry, large public housing campuses, older residential blocks, new high-rise development, nightlife, and major transportation infrastructure. It is one of the clearest examples of Queens as both a residential borough and a regional employment and infrastructure hub.
Queens Community Board 1 — Interactive District Map
Open full map ↗QNCB1
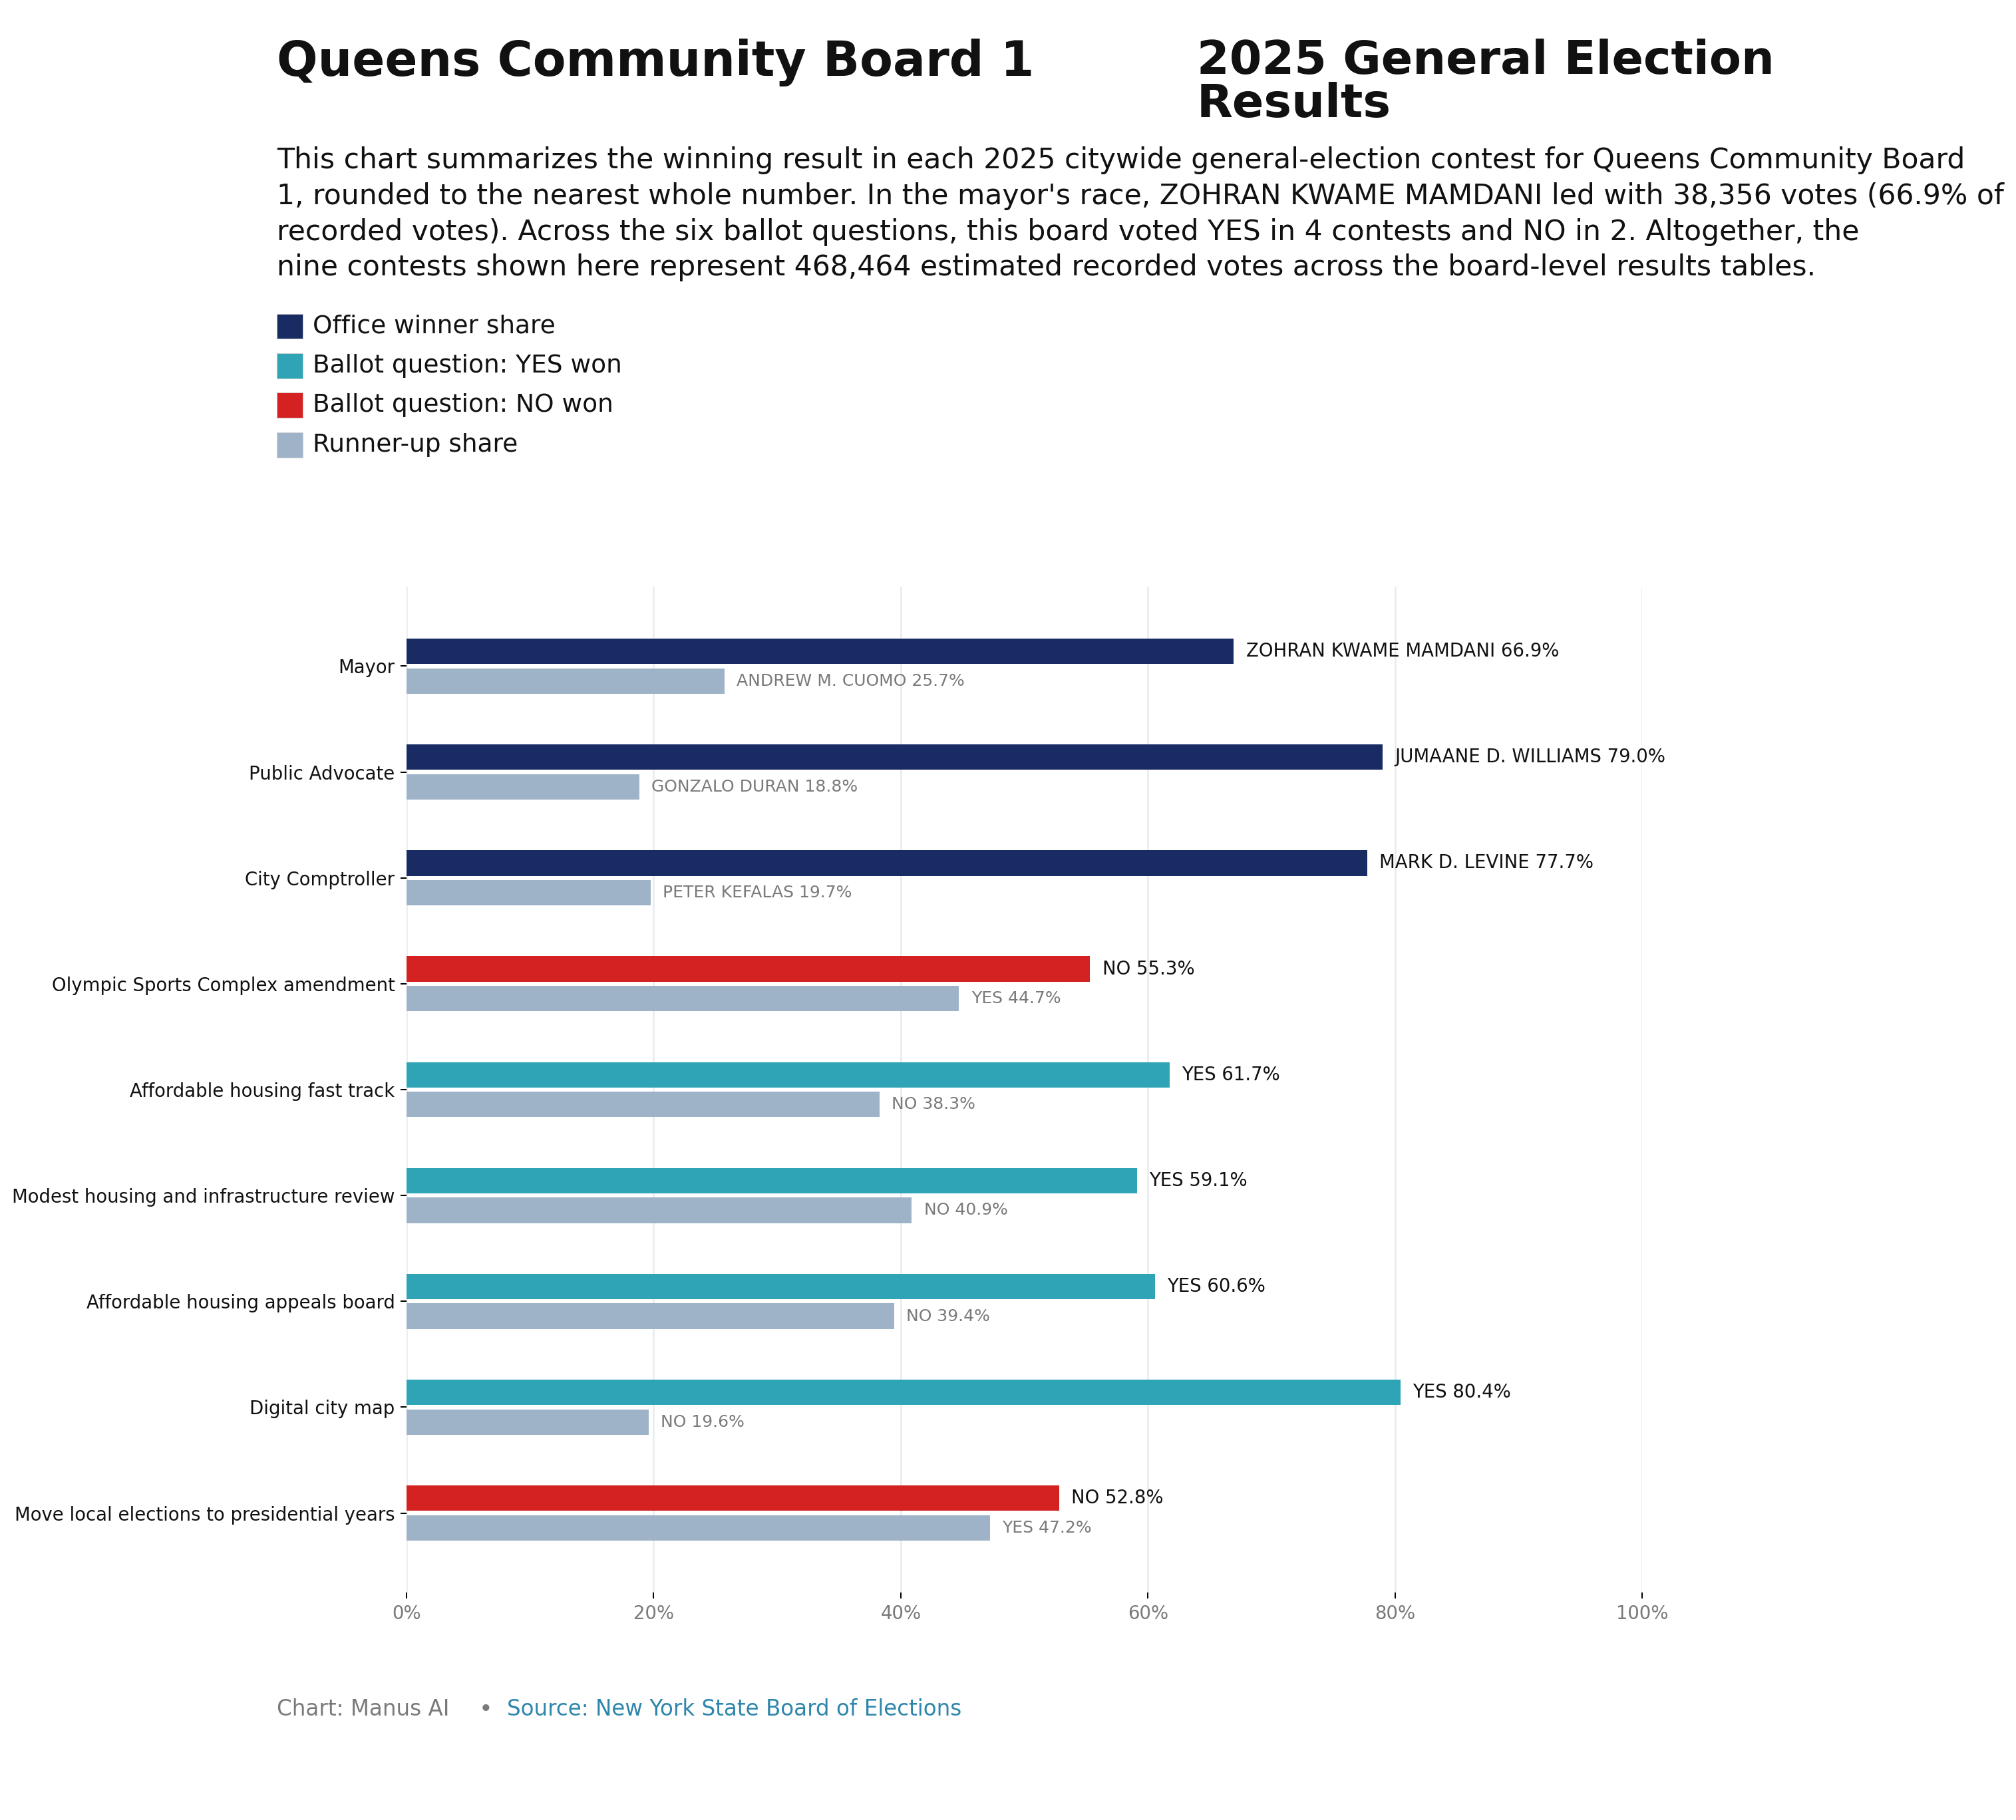
QNCB1 — Mamdani won this CB district 67.3% to 26.0% for Cuomo and 6.7% for Sliwa, and carried 89 of 96 election districts here.
Community Health Profile
Long Island City and Astoria · Source: NYC DOHMH 2026 Community Health Profiles
▼ Full data table (all 58 indicators)
| Indicator | Value | Boro Rank | NYC Rank | Rank |
|---|---|---|---|---|
| Total Population | 190,522 | #4 of 14 | #10 of 59 | ↑ #4 |
| Age 0–17 | 15.3% | #13 of 14 | #48 of 59 | ↑ #13 |
| Age 18–24 | 8.8% | #2 of 14 | #26 of 59 | ↑ #2 |
| Age 25–44 | 37.8% | #1 of 14 | #10 of 59 | ↑ #1 |
| Age 45–64 | 22.0% | #14 of 14 | #44 of 59 | ↑ #14 |
| Age 65+ | 16.1% | #13 of 14 | #37 of 59 | ↑ #13 |
| Asian | 17.2% | #11 of 14 | #20 of 59 | ↑ #11 |
| Black | 9.7% | #6 of 14 | #33 of 59 | ↑ #6 |
| Latino | 30.4% | #6 of 14 | #24 of 59 | ↑ #6 |
| White | 40.4% | #3 of 14 | #20 of 59 | ↑ #3 |
| Other race/ethnicity | 2.3% | #8 of 14 | #28 of 59 | ↑ #8 |
| Limited English Proficiency | 19.8% | #10 of 14 | #28 of 59 | ↑ #10 |
| Born Outside the US | 37.1% | #13 of 14 | #26 of 59 | ↑ #13 |
| Elementary School Absenteeism | 38.2% | #12 of 14 | #36 of 59 | ↓ #12 |
| On-Time High School Graduation | 85.6% | #12 of 14 | #30 of 59 | ↑ #12 |
| Did Not Complete High School | 10.9% | #2 of 14 | #12 of 59 | ↓ #2 |
| High School Grad / Some College | 30.9% | #13 of 14 | #44 of 59 | ↑ #13 |
| College Degree or Higher | 58.2% | #2 of 14 | #13 of 59 | ↑ #2 |
| Poverty | 15.0% | #5 of 14 | #16 of 59 | ↓ #5 |
| Unemployment | 7.4% | #11 of 14 | #32 of 59 | ↓ #11 |
| Rent Burden | 43.0% | #1 of 14 | #11 of 59 | ↓ #1 |
| Avertable Deaths | 23.0 | #8 of 14 | #17 of 59 | ↓ #8 |
| Helpful Neighbors | 68.8% | #1 of 14 | #7 of 59 | ↑ #1 |
| Non-Fatal Assault Hospitalizations | 56.7 | #13 of 14 | #38 of 59 | ↓ #13 |
| Jail Incarceration | 155.9 | #12 of 14 | #32 of 59 | ↓ #12 |
| Air Conditioning | 92.7% | #9 of 14 | #22 of 59 | ↑ #9 |
| Air Pollution | 7.0 | #13 of 14 | #42 of 59 | ↓ #13 |
| Renter Homes with Health-Related Housing Problems | 56.0% | #7 of 14 | #20 of 59 | ↓ #7 |
| Homes Reporting Cockroaches | 24.1% | #6 of 14 | #20 of 59 | ↓ #6 |
| Ratio of Bodegas to Supermarkets | 8.0 | #9 of 14 | #25 of 59 | ↓ #9 |
| Farmers Markets | 0 | #11 of 14 | #53 of 59 | ↑ #11 |
| Bicycle Network Coverage | 26.6% | #1 of 14 | #24 of 59 | ↑ #1 |
| Pedestrian Injury Hospitalizations | 12.1 | #6 of 14 | #17 of 59 | ↓ #6 |
| Late or No Prenatal Care | 8.8% | #9 of 14 | #30 of 59 | ↓ #9 |
| Preterm Births | 9.1% | #7 of 14 | #22 of 59 | ↓ #7 |
| Teen Births | 5.3% | #8 of 14 | #19 of 59 | ↓ #8 |
| Childhood Obesity | 21.4% | #6 of 14 | #25 of 59 | ↓ #6 |
| Child Asthma Emergency Department Visits | 88.0 | #6 of 14 | #19 of 59 | ↓ #6 |
| Self-Reported Good Health | 84.9% | #10 of 14 | #28 of 59 | ↑ #10 |
| Physical Activity | 83.4% | #1 of 14 | #10 of 59 | ↑ #1 |
| Sugary Drink Consumption | 8.8% | #3 of 14 | #11 of 59 | ↓ #3 |
| Fruit and Vegetable Consumption | 90.5% | #5 of 14 | #20 of 59 | ↑ #5 |
| Current Smokers | 11.2% | #14 of 14 | #46 of 59 | ↓ #14 |
| Uninsured | 10.2% | #2 of 14 | #28 of 59 | ↓ #2 |
| Unmet Medical Care | 13.2% | #4 of 14 | #19 of 59 | ↓ #4 |
| Avoidable Hospitalizations Among Adults | 805.0 | #9 of 14 | #26 of 59 | ↓ #9 |
| Fall-Related Hospitalizations Among Older Adults | 1301.7 | #10 of 14 | #25 of 59 | ↓ #10 |
| Flu Vaccination | 55.5% | #1 of 14 | #12 of 59 | ↑ #1 |
| HPV Vaccination | 34.6% | #12 of 14 | #44 of 59 | ↑ #12 |
| Obesity | 18.3% | #4 of 14 | #14 of 59 | ↓ #4 |
| Diabetes | 14.2% | #9 of 14 | #36 of 59 | ↓ #9 |
| Hypertension | 28.2% | #7 of 14 | #26 of 59 | ↓ #7 |
| New HIV Diagnoses | 17.8 | #11 of 14 | #31 of 59 | ↓ #11 |
| New Hepatitis C Reports | 25.0 | #10 of 14 | #30 of 59 | ↓ #10 |
| Binge Drinking | 29.2% | #14 of 14 | #45 of 59 | ↓ #14 |
| Psychiatric Hospitalizations | 503.7 | #11 of 14 | #37 of 59 | ↓ #11 |
| Infant Mortality | 2.2 | #2 of 14 | #15 of 59 | ↓ #2 |
| Premature Mortality Number | 1,397 | #11 of 14 | #38 of 59 | ↓ #11 |
| Premature Mortality Rate | 159.9 | #9 of 14 | #24 of 59 | ↓ #9 |
| Life Expectancy | 84.0 years | #8 of 14 | #22 of 59 | ↑ #8 |