5
Queens Community Board 5
About This District
Queens Community District 5
Queens Community District 5 encompasses Maspeth, Middle Village, Ridgewood, and Glendale. Covering 7.3 square miles and home to more than 170,000 residents, it sits on the western edge of Queens along the Brooklyn line.
It includes rowhouse neighborhoods, lower-density residential areas, cemeteries, industrial space, rail corridors, and commercial streets. The district often feels less like one center and more like several neighborhoods sharing infrastructure, truck routes, schools, parks, and local business corridors.
Queens Community Board 5 — Interactive District Map
Open full map ↗2025 General Election Results
2025 NOVEMBER GENERAL ELECTION
QNCB5
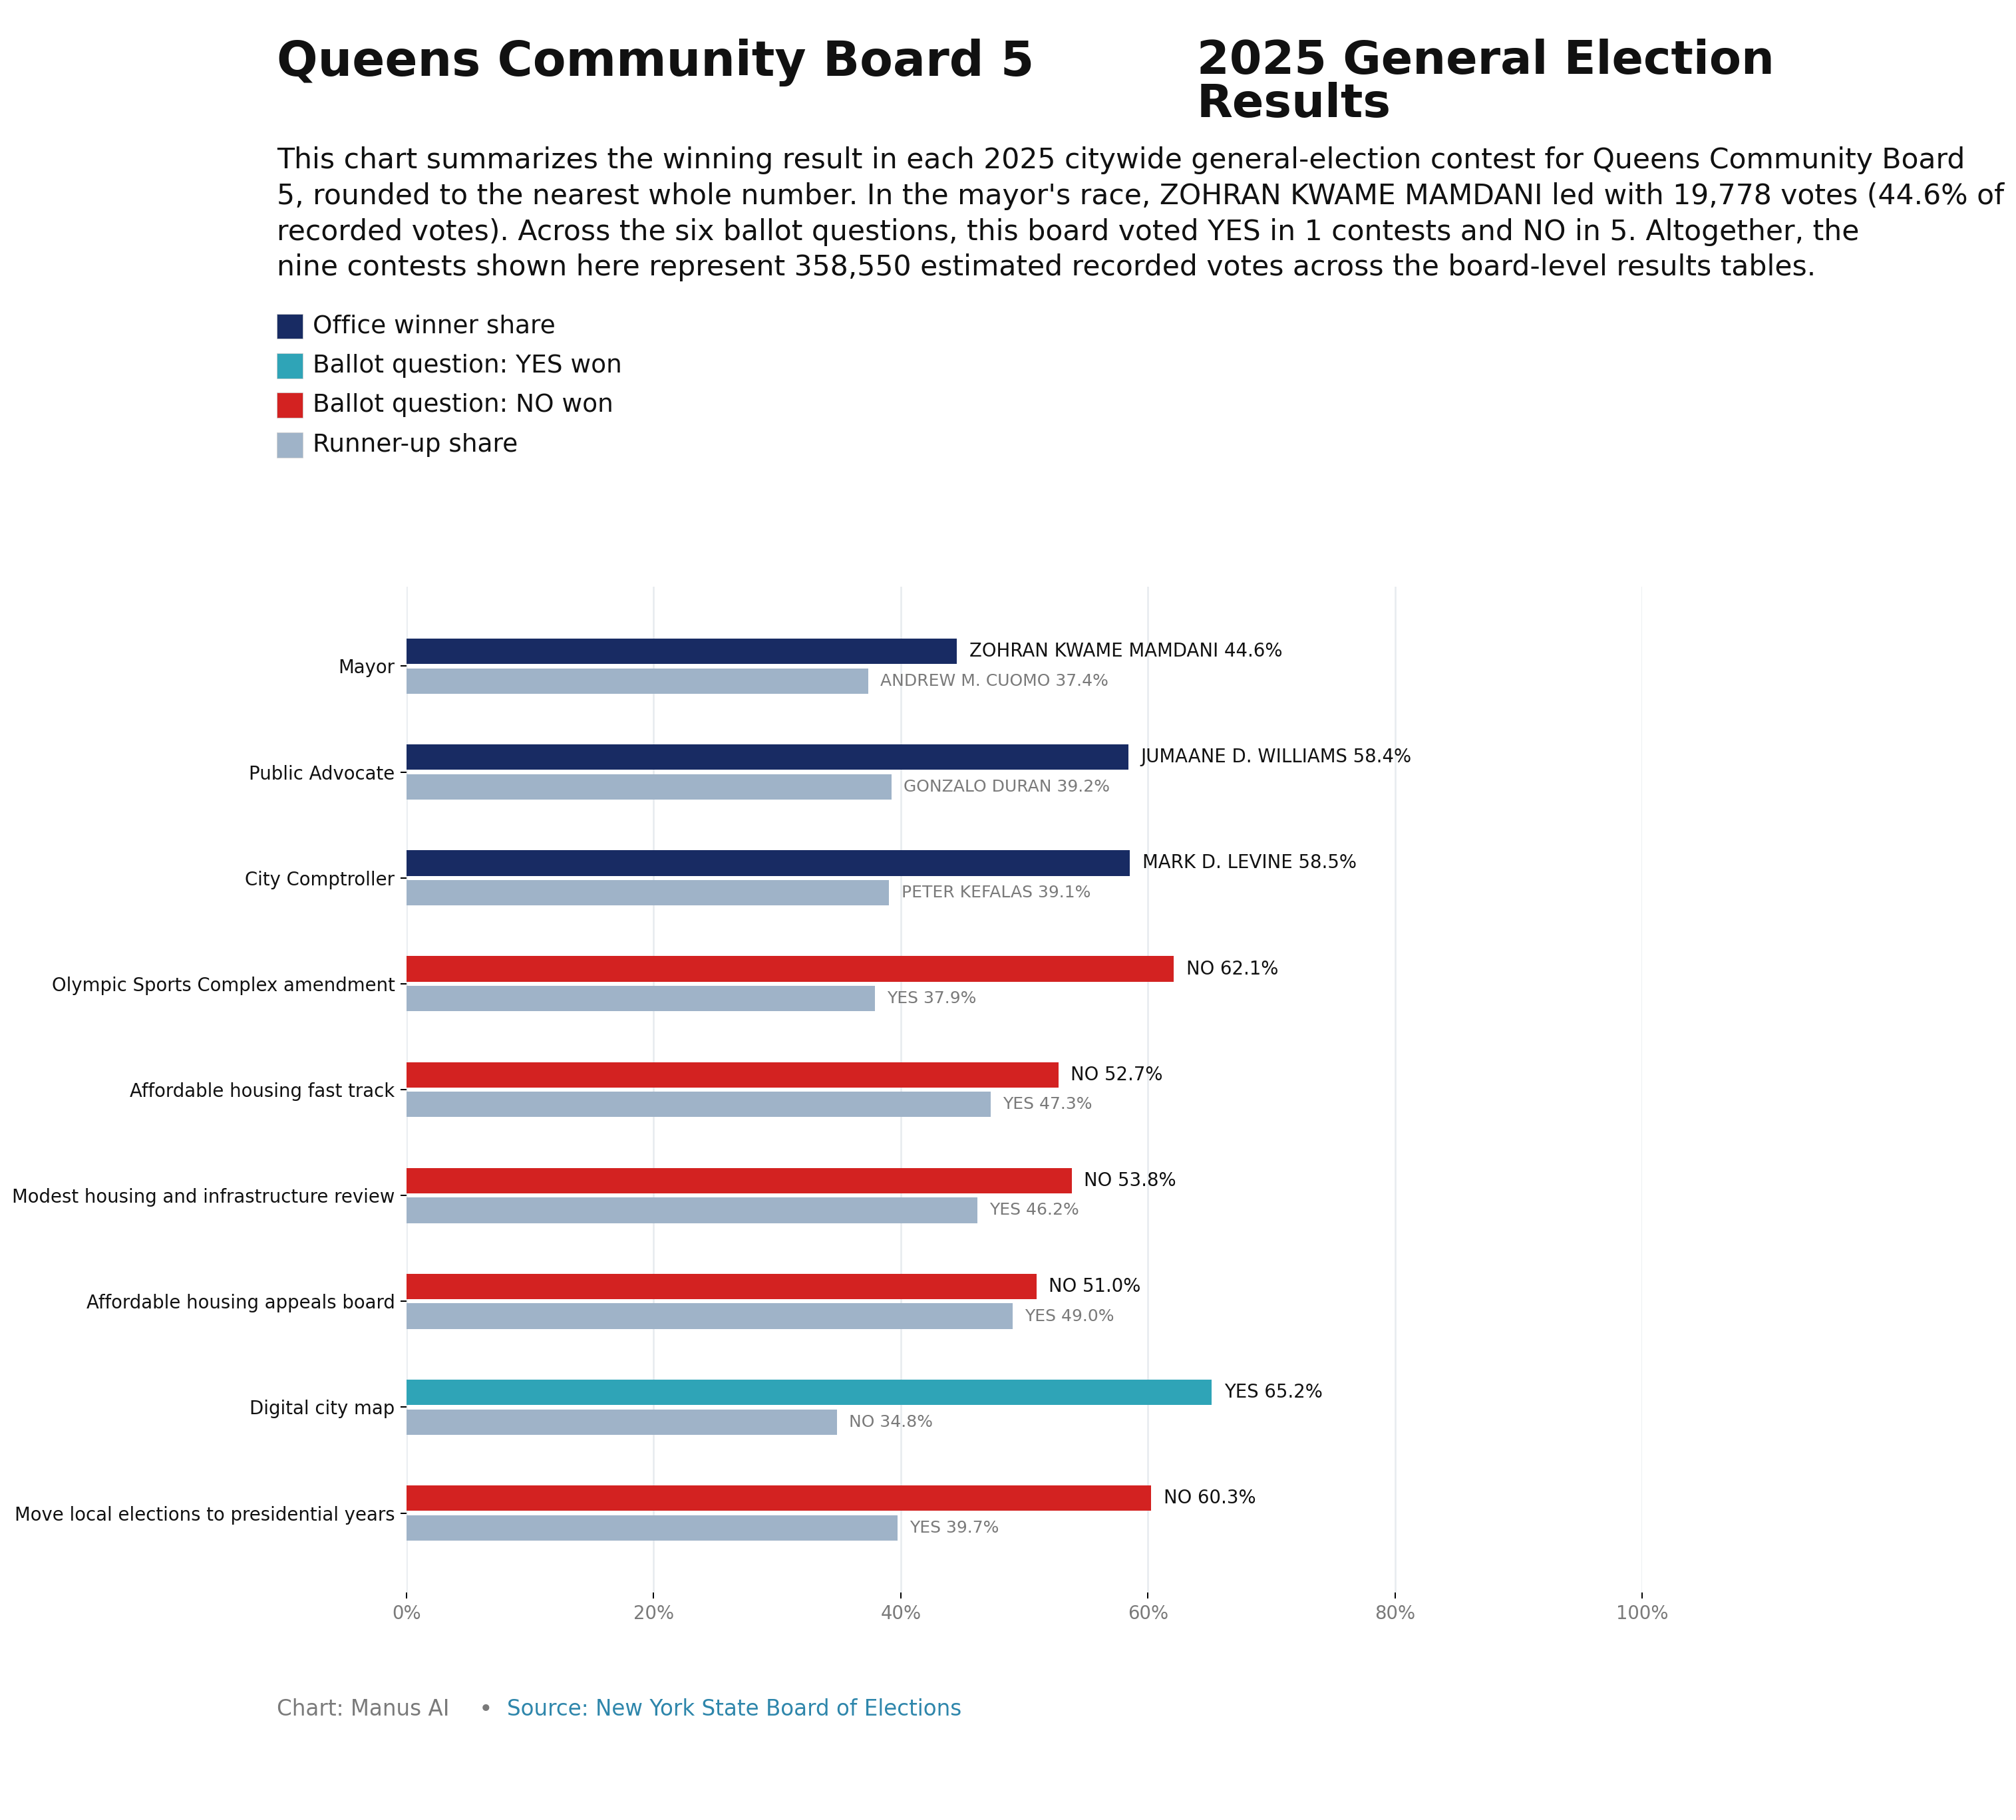
QNCB5 — Mamdani won this CB district 44.9% to 37.5% for Cuomo and 17.6% for Sliwa, and carried 40 of 83 election districts here.
Mamdani won 40 of 83 election districts in QNCB5.
Winner
Mamdani by 7.4%
EDs carried
Mamdani: 40 of 83
Mamdani
44.9%
Cuomo
37.5%
Sliwa 17.6%
Mayor
Citywide: Mamdani 39/59 (66%) · Cuomo 20/59 (34%)
Q1 — Olympic Sports Complex
Citywide: NO 45/59 (76%) · YES 14/59 (24%)
Q2 — Fast Track Affordable Housing
Citywide: YES 46/59 (78%) · NO 13/59 (22%)
Q3 — Simplify Housing & Infrastructure Review
Citywide: YES 45/59 (76%) · NO 14/59 (24%)
Q4 — Affordable Housing Appeals Board
Citywide: YES 47/59 (80%) · NO 12/59 (20%)
Q5 — Digital City Map
Citywide: YES 55/59 (93%) · NO 4/59 (7%)
Q6 — Move Local Elections to Presidential Years
Citywide: NO 31/59 (53%) · YES 28/59 (47%)
Queens CB5 — 2025 General Election Results
Community Health Profile
Ridgewood and Maspeth · Source: NYC DOHMH 2026 Community Health Profiles
Demographics
Total Population
157,918
Boro #7
NYC #20
Age 0–17
21.6%
Boro #3
NYC #20
Age 18–24
7.6%
Boro #9
NYC #45
Age 25–44
29.3%
Boro #5
NYC #28
Age 45–64
25.1%
Boro #9
NYC #17
Age 65+
16.4%
Boro #11
NYC #32
Asian
9.9%
Boro #13
NYC #30
Black
1.5%
Boro #14
NYC #56
Latino
37.3%
Boro #4
NYC #21
White
50.0%
Boro #1
NYC #16
Other race/ethnicity
1.3%
Boro #14
NYC #52
Limited English Proficiency
25.5%
Boro #8
NYC #22
Born Outside the US
39.2%
Boro #12
NYC #22
Education
Elementary School Absenteeism
28.6%
Boro #7
NYC #19
On-Time High School Graduation
90.0%
Boro #6
NYC #13
Did Not Complete High School
16.3%
Boro #7
NYC #32
High School Grad / Some College
43.2%
Boro #5
NYC #23
College Degree or Higher
40.5%
Boro #7
NYC #34
Economy
Poverty
15.2%
Boro #7
NYC #19
Unemployment
6.1%
Boro #5
NYC #16
Rent Burden
46.0%
Boro #5
NYC #17
Helpful Neighbors
52.8%
Boro #11
NYC #40
Jail Incarceration
83.8
Boro #5
NYC #12
Environment & Housing
Air Conditioning
95.7%
Boro #2
NYC #10
Air Pollution
6.9
Boro #11
NYC #33
Renter Housing Problems
53.0%
Boro #6
NYC #19
Homes Reporting Cockroaches
18.5%
Boro #2
NYC #11
Bodega:Supermarket Ratio
10.3
Boro #12
NYC #41
Farmers Markets
1
Boro #7
NYC #48
Bike Network Coverage
13.5%
Boro #7
NYC #42
Non-Fatal Assault Hospitalizations
22.8
Boro #5
NYC #13
Maternal & Child Health
Late or No Prenatal Care
6.9%
Boro #5
NYC #23
Preterm Births
10.0%
Boro #9
NYC #31
Teen Births
7.2%
Boro #9
NYC #25
Childhood Obesity
23.2%
Boro #8
NYC #29
Child Asthma ED Visits
69.8
Boro #5
NYC #13
Health Behaviors
Self-Reported Good Health
85.6%
Boro #8
NYC #23
Physical Activity
71.9%
Boro #4
NYC #20
Sugary Drink Consumption
13.5%
Boro #7
NYC #24
Fruit and Vegetable Consumption
88.7%
Boro #7
NYC #29
Current Smokers
10.7%
Boro #11
NYC #43
Binge Drinking
27.8%
Boro #13
NYC #43
Obesity
38.0%
Boro #13
NYC #48
Healthcare Access
Uninsured
10.9%
Boro #5
NYC #32
Unmet Medical Care
14.0%
Boro #6
NYC #25
Flu Vaccination
48.5%
Boro #7
NYC #34
HPV Vaccination
39.4%
Boro #9
NYC #36
Disease & Mortality
Avoidable Hospitalizations
762.9
Boro #8
NYC #24
Fall Hospitalizations
1558.6
Boro #14
NYC #42
Diabetes
10.9%
Boro #5
NYC #22
Hypertension
27.8%
Boro #6
NYC #24
New HIV Diagnoses
11.7
Boro #6
NYC #22
New Hepatitis C Reports
19.1
Boro #6
NYC #13
Psychiatric Hospitalizations
312.9
Boro #7
NYC #16
Infant Mortality
2.8
Boro #4
NYC #22
Premature Mortality Number
1,340
Boro #10
NYC #34
Premature Mortality Rate
174.5
Boro #10
NYC #29
Life Expectancy
81.8 years
Boro #11
NYC #34
▼ Full data table (all 58 indicators)
| Indicator | Value | Boro Rank | NYC Rank | Rank |
|---|---|---|---|---|
| Total Population | 157,918 | #7 of 14 | #20 of 59 | ↑ #7 |
| Age 0–17 | 21.6% | #3 of 14 | #20 of 59 | ↑ #3 |
| Age 18–24 | 7.6% | #9 of 14 | #45 of 59 | ↑ #9 |
| Age 25–44 | 29.3% | #5 of 14 | #28 of 59 | ↑ #5 |
| Age 45–64 | 25.1% | #9 of 14 | #17 of 59 | ↑ #9 |
| Age 65+ | 16.4% | #11 of 14 | #32 of 59 | ↑ #11 |
| Asian | 9.9% | #13 of 14 | #30 of 59 | ↑ #13 |
| Black | 1.5% | #14 of 14 | #56 of 59 | ↑ #14 |
| Latino | 37.3% | #4 of 14 | #21 of 59 | ↑ #4 |
| White | 50.0% | #1 of 14 | #16 of 59 | ↑ #1 |
| Other race/ethnicity | 1.3% | #14 of 14 | #52 of 59 | ↑ #14 |
| Limited English Proficiency | 25.5% | #8 of 14 | #22 of 59 | ↑ #8 |
| Born Outside the US | 39.2% | #12 of 14 | #22 of 59 | ↑ #12 |
| Elementary School Absenteeism | 28.6% | #7 of 14 | #19 of 59 | ↓ #7 |
| On-Time High School Graduation | 90.0% | #6 of 14 | #13 of 59 | ↑ #6 |
| Did Not Complete High School | 16.3% | #7 of 14 | #32 of 59 | ↓ #7 |
| High School Grad / Some College | 43.2% | #5 of 14 | #23 of 59 | ↑ #5 |
| College Degree or Higher | 40.5% | #7 of 14 | #34 of 59 | ↑ #7 |
| Poverty | 15.2% | #7 of 14 | #19 of 59 | ↓ #7 |
| Unemployment | 6.1% | #5 of 14 | #16 of 59 | ↓ #5 |
| Rent Burden | 46.0% | #5 of 14 | #17 of 59 | ↓ #5 |
| Avertable Deaths | 36.3 | #11 of 14 | #30 of 59 | ↓ #11 |
| Helpful Neighbors | 52.8% | #11 of 14 | #40 of 59 | ↑ #11 |
| Non-Fatal Assault Hospitalizations | 22.8 | #5 of 14 | #13 of 59 | ↓ #5 |
| Jail Incarceration | 83.8 | #5 of 14 | #12 of 59 | ↓ #5 |
| Air Conditioning | 95.7% | #2 of 14 | #10 of 59 | ↑ #2 |
| Air Pollution | 6.9 | #11 of 14 | #33 of 59 | ↓ #11 |
| Renter Homes with Health-Related Housing Problems | 53.0% | #6 of 14 | #19 of 59 | ↓ #6 |
| Homes Reporting Cockroaches | 18.5% | #2 of 14 | #11 of 59 | ↓ #2 |
| Ratio of Bodegas to Supermarkets | 10.3 | #12 of 14 | #41 of 59 | ↓ #12 |
| Farmers Markets | 1 | #7 of 14 | #48 of 59 | ↑ #7 |
| Bicycle Network Coverage | 13.5% | #7 of 14 | #42 of 59 | ↑ #7 |
| Pedestrian Injury Hospitalizations | 13.7 | #8 of 14 | #23 of 59 | ↓ #8 |
| Late or No Prenatal Care | 6.9% | #5 of 14 | #23 of 59 | ↓ #5 |
| Preterm Births | 10.0% | #9 of 14 | #31 of 59 | ↓ #9 |
| Teen Births | 7.2% | #9 of 14 | #25 of 59 | ↓ #9 |
| Childhood Obesity | 23.2% | #8 of 14 | #29 of 59 | ↓ #8 |
| Child Asthma Emergency Department Visits | 69.8 | #5 of 14 | #13 of 59 | ↓ #5 |
| Self-Reported Good Health | 85.6% | #8 of 14 | #23 of 59 | ↑ #8 |
| Physical Activity | 71.9% | #4 of 14 | #20 of 59 | ↑ #4 |
| Sugary Drink Consumption | 13.5% | #7 of 14 | #24 of 59 | ↓ #7 |
| Fruit and Vegetable Consumption | 88.7% | #7 of 14 | #29 of 59 | ↑ #7 |
| Current Smokers | 10.7% | #11 of 14 | #43 of 59 | ↓ #11 |
| Uninsured | 10.9% | #5 of 14 | #32 of 59 | ↓ #5 |
| Unmet Medical Care | 14.0% | #6 of 14 | #25 of 59 | ↓ #6 |
| Avoidable Hospitalizations Among Adults | 762.9 | #8 of 14 | #24 of 59 | ↓ #8 |
| Fall-Related Hospitalizations Among Older Adults | 1558.6 | #14 of 14 | #42 of 59 | ↓ #14 |
| Flu Vaccination | 48.5% | #7 of 14 | #34 of 59 | ↑ #7 |
| HPV Vaccination | 39.4% | #9 of 14 | #36 of 59 | ↑ #9 |
| Obesity | 38.0% | #13 of 14 | #48 of 59 | ↓ #13 |
| Diabetes | 10.9% | #5 of 14 | #22 of 59 | ↓ #5 |
| Hypertension | 27.8% | #6 of 14 | #24 of 59 | ↓ #6 |
| New HIV Diagnoses | 11.7 | #6 of 14 | #22 of 59 | ↓ #6 |
| New Hepatitis C Reports | 19.1 | #6 of 14 | #13 of 59 | ↓ #6 |
| Binge Drinking | 27.8% | #13 of 14 | #43 of 59 | ↓ #13 |
| Psychiatric Hospitalizations | 312.9 | #7 of 14 | #16 of 59 | ↓ #7 |
| Infant Mortality | 2.8 | #4 of 14 | #22 of 59 | ↓ #4 |
| Premature Mortality Number | 1,340 | #10 of 14 | #34 of 59 | ↓ #10 |
| Premature Mortality Rate | 174.5 | #10 of 14 | #29 of 59 | ↓ #10 |
| Life Expectancy | 81.8 years | #11 of 14 | #34 of 59 | ↑ #11 |