8
Queens Community Board 8
About This District
Queens Community District 8
Queens Community District 8 encompasses Fresh Meadows, Kew Gardens Hills, and Jamaica Hills. Covering 4.8 square miles and home to more than 150,000 residents, it covers central Queens.
It is primarily residential, with apartment buildings, co-ops, one- and two-family homes, schools, institutions, and major roadways.
Queens Community Board 8 — Interactive District Map
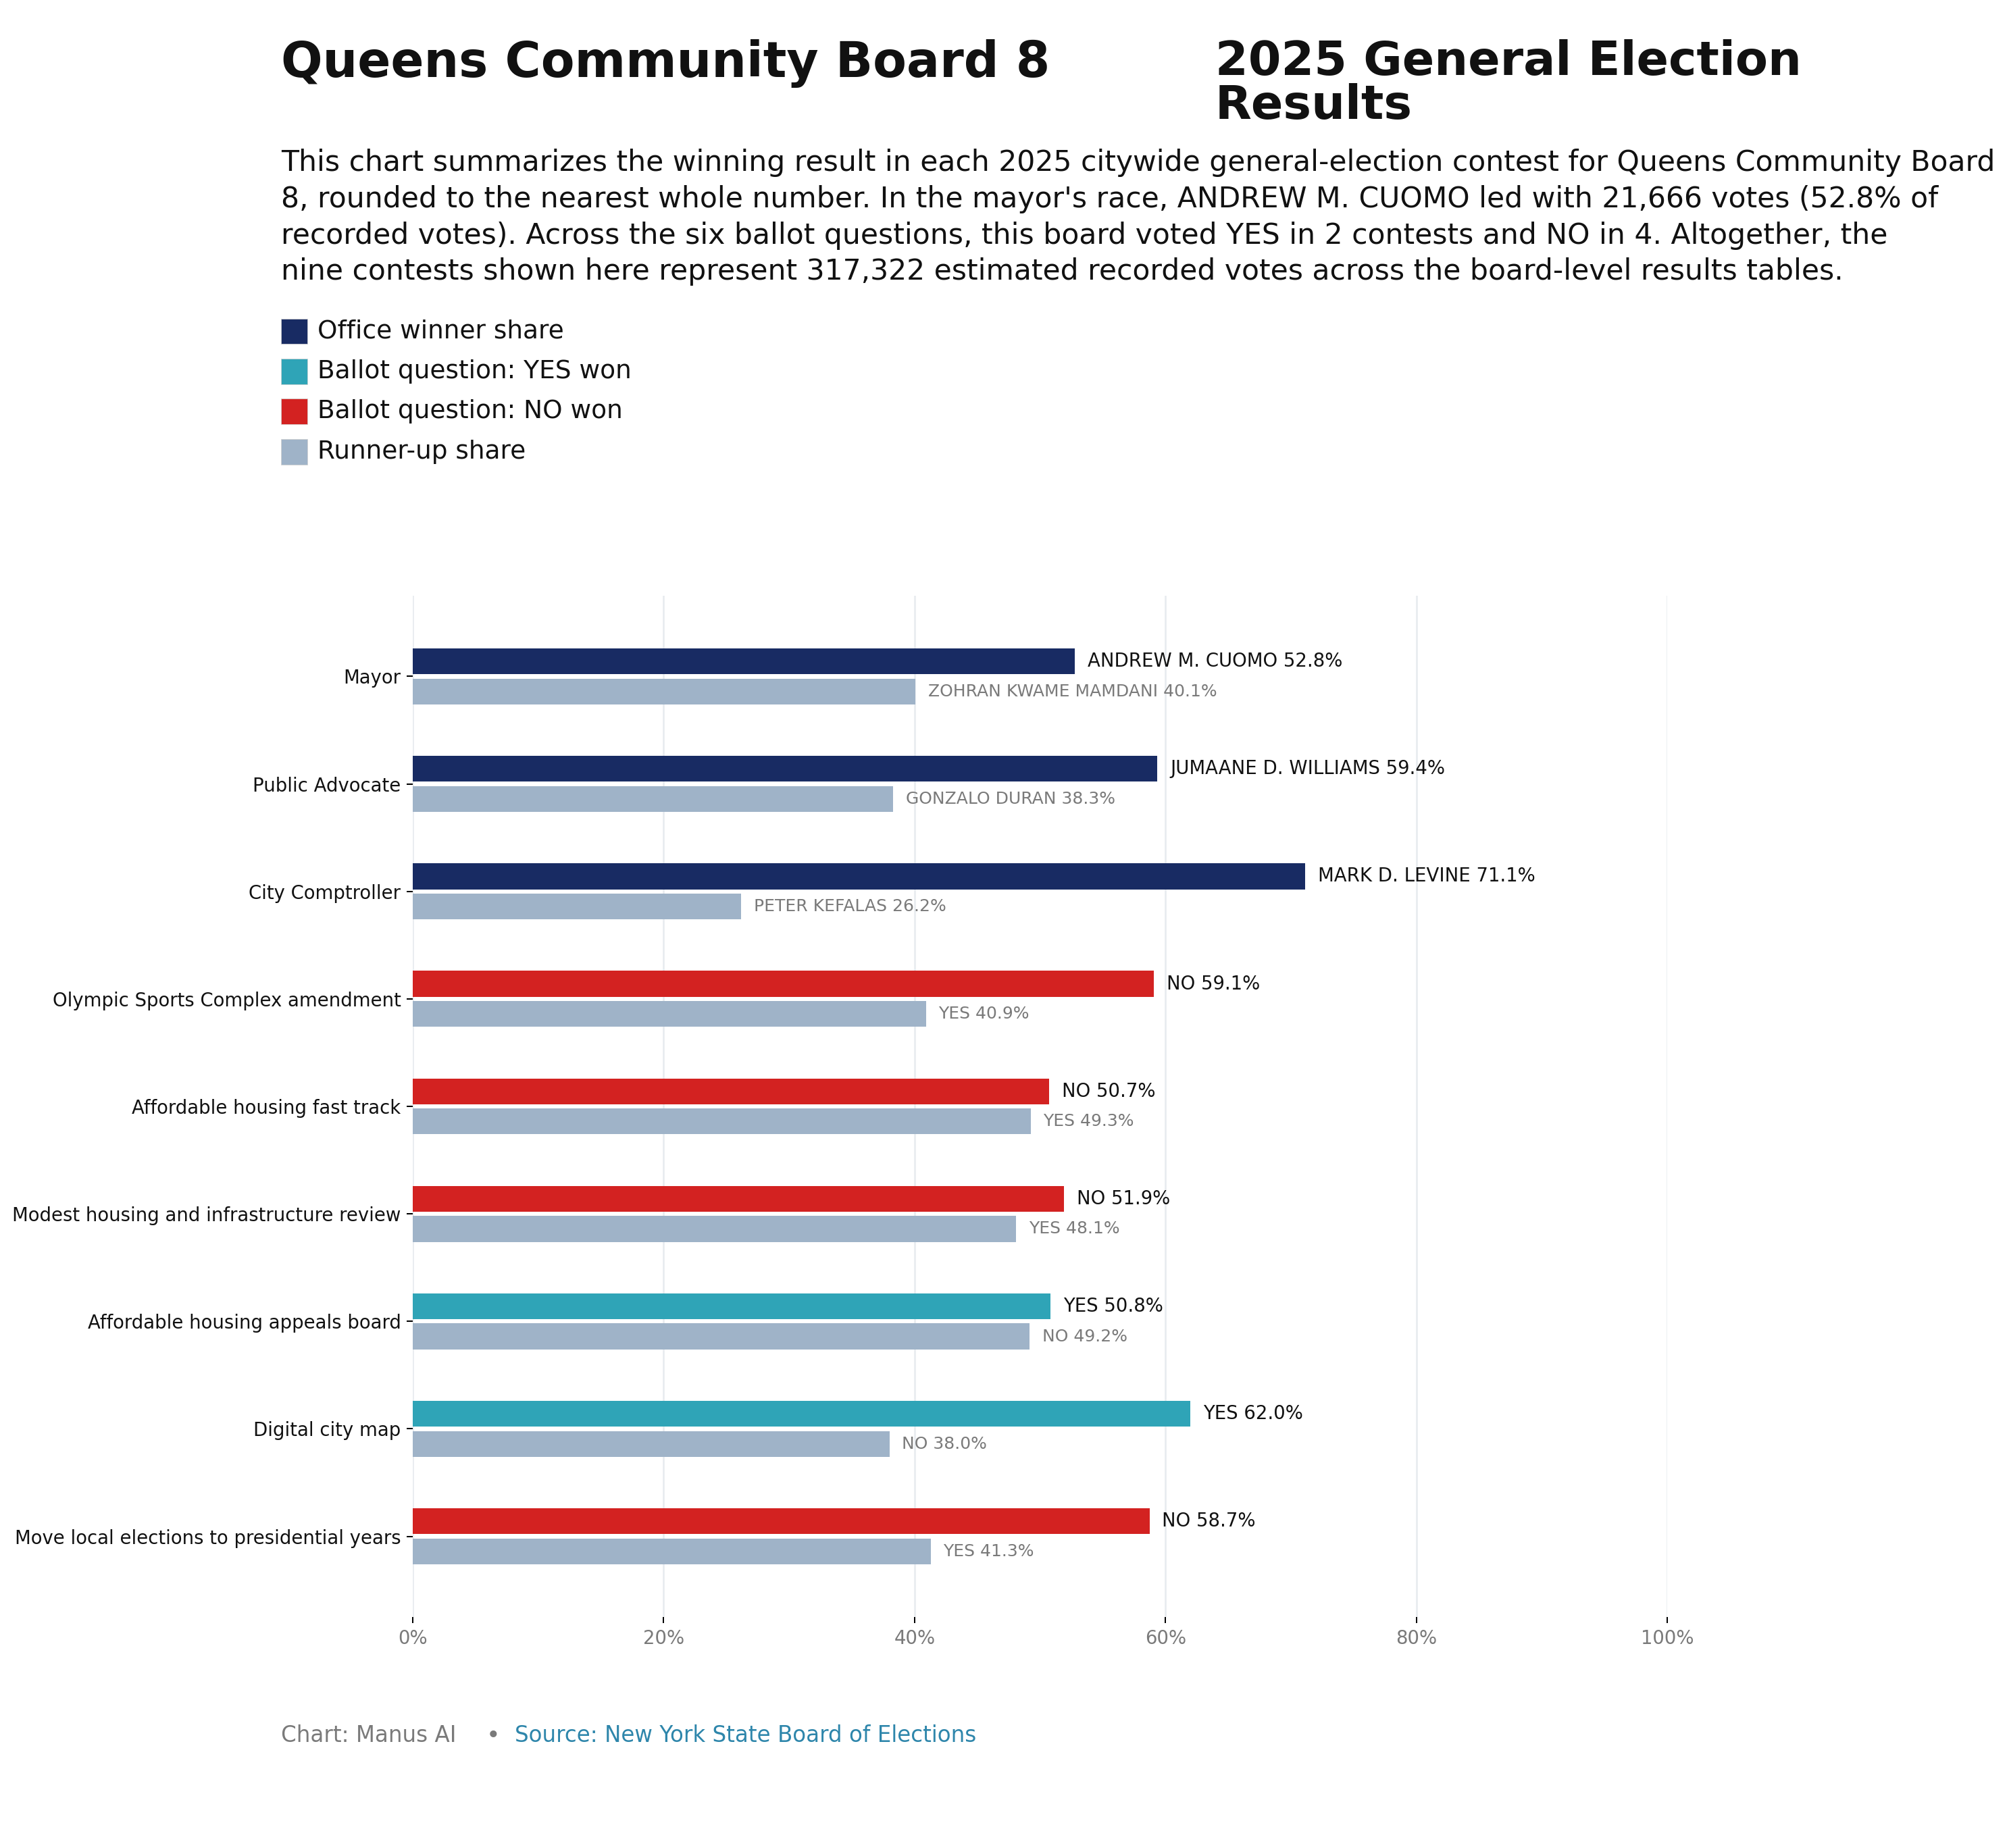
Open full map ↗2025 General Election Results
2025 NOVEMBER GENERAL ELECTION
QNCB8
QNCB8 — Cuomo won this CB district 41.7% to 51.3% for Cuomo and 7.0% for Sliwa, and carried 39 of 78 election districts here.
Cuomo won 39 of 78 election districts in QNCB8.
Winner
Cuomo by 9.7%
EDs carried
Cuomo: 39 of 78
Mamdani
41.7%
Cuomo
51.3%
Sliwa 7.0%
Mayor
Citywide: Mamdani 39/59 (66%) · Cuomo 20/59 (34%)
Q1 — Olympic Sports Complex
Citywide: NO 45/59 (76%) · YES 14/59 (24%)
Q2 — Fast Track Affordable Housing
Citywide: YES 46/59 (78%) · NO 13/59 (22%)
Q3 — Simplify Housing & Infrastructure Review
Citywide: YES 45/59 (76%) · NO 14/59 (24%)
Q4 — Affordable Housing Appeals Board
Citywide: YES 47/59 (80%) · NO 12/59 (20%)
Q5 — Digital City Map
Citywide: YES 55/59 (93%) · NO 4/59 (7%)
Q6 — Move Local Elections to Presidential Years
Citywide: NO 31/59 (53%) · YES 28/59 (47%)
Queens CB8 — 2025 General Election Results
Community Health Profile
Hillcrest and Fresh Meadows · Source: NYC DOHMH 2026 Community Health Profiles
Demographics
Total Population
154,491
Boro #8
NYC #22
Age 0–17
19.0%
Boro #8
NYC #38
Age 18–24
8.8%
Boro #1
NYC #25
Age 25–44
25.6%
Boro #10
NYC #51
Age 45–64
26.0%
Boro #8
NYC #12
Age 65+
20.6%
Boro #5
NYC #12
Asian
37.1%
Boro #3
NYC #5
Black
12.4%
Boro #5
NYC #31
Latino
18.2%
Boro #9
NYC #33
White
29.0%
Boro #6
NYC #26
Other race/ethnicity
3.4%
Boro #4
NYC #8
Limited English Proficiency
29.2%
Boro #5
NYC #14
Born Outside the US
47.4%
Boro #6
NYC #9
Education
Elementary School Absenteeism
30.5%
Boro #8
NYC #20
On-Time High School Graduation
90.2%
Boro #5
NYC #12
Did Not Complete High School
13.3%
Boro #6
NYC #22
High School Grad / Some College
33.8%
Boro #10
NYC #38
College Degree or Higher
52.8%
Boro #5
NYC #16
Economy
Poverty
16.5%
Boro #9
NYC #24
Unemployment
7.4%
Boro #10
NYC #31
Rent Burden
45.0%
Boro #3
NYC #13
Helpful Neighbors
54.3%
Boro #10
NYC #35
Jail Incarceration
112.6
Boro #6
NYC #20
Environment & Housing
Air Conditioning
94.9%
Boro #3
NYC #12
Air Pollution
6.5
Boro #5
NYC #12
Renter Housing Problems
65.0%
Boro #11
NYC #34
Homes Reporting Cockroaches
41.7%
Boro #12
NYC #43
Bodega:Supermarket Ratio
5.1
Boro #5
NYC #8
Farmers Markets
1
Boro #4
NYC #44
Bike Network Coverage
14.1%
Boro #6
NYC #41
Non-Fatal Assault Hospitalizations
20.9
Boro #3
NYC #10
Maternal & Child Health
Late or No Prenatal Care
6.9%
Boro #4
NYC #22
Preterm Births
8.8%
Boro #4
NYC #19
Teen Births
2.8%
Boro #2
NYC #8
Childhood Obesity
18.4%
Boro #4
NYC #17
Child Asthma ED Visits
101.7
Boro #9
NYC #26
Health Behaviors
Self-Reported Good Health
86.0%
Boro #6
NYC #17
Physical Activity
69.1%
Boro #7
NYC #26
Sugary Drink Consumption
11.3%
Boro #6
NYC #20
Fruit and Vegetable Consumption
92.0%
Boro #2
NYC #13
Current Smokers
5.3%
Boro #5
NYC #14
Binge Drinking
18.2%
Boro #6
NYC #10
Obesity
28.5%
Boro #10
NYC #32
Healthcare Access
Uninsured
10.3%
Boro #3
NYC #30
Unmet Medical Care
13.0%
Boro #3
NYC #17
Flu Vaccination
51.8%
Boro #3
NYC #19
HPV Vaccination
41.1%
Boro #8
NYC #34
Disease & Mortality
Avoidable Hospitalizations
676.9
Boro #6
NYC #18
Fall Hospitalizations
1193.0
Boro #7
NYC #22
Diabetes
16.9%
Boro #12
NYC #49
Hypertension
28.3%
Boro #8
NYC #27
New HIV Diagnoses
6.0
Boro #3
NYC #9
New Hepatitis C Reports
17.3
Boro #5
NYC #11
Psychiatric Hospitalizations
311.1
Boro #6
NYC #15
Infant Mortality
3.4
Boro #7
NYC #27
Premature Mortality Number
980
Boro #4
NYC #18
Premature Mortality Rate
132.4
Boro #5
NYC #13
Life Expectancy
85.1 years
Boro #6
NYC #14
▼ Full data table (all 58 indicators)
| Indicator | Value | Boro Rank | NYC Rank | Rank |
|---|---|---|---|---|
| Total Population | 154,491 | #8 of 14 | #22 of 59 | ↑ #8 |
| Age 0–17 | 19.0% | #8 of 14 | #38 of 59 | ↑ #8 |
| Age 18–24 | 8.8% | #1 of 14 | #25 of 59 | ↑ #1 |
| Age 25–44 | 25.6% | #10 of 14 | #51 of 59 | ↑ #10 |
| Age 45–64 | 26.0% | #8 of 14 | #12 of 59 | ↑ #8 |
| Age 65+ | 20.6% | #5 of 14 | #12 of 59 | ↑ #5 |
| Asian | 37.1% | #3 of 14 | #5 of 59 | ↑ #3 |
| Black | 12.4% | #5 of 14 | #31 of 59 | ↑ #5 |
| Latino | 18.2% | #9 of 14 | #33 of 59 | ↑ #9 |
| White | 29.0% | #6 of 14 | #26 of 59 | ↑ #6 |
| Other race/ethnicity | 3.4% | #4 of 14 | #8 of 59 | ↑ #4 |
| Limited English Proficiency | 29.2% | #5 of 14 | #14 of 59 | ↑ #5 |
| Born Outside the US | 47.4% | #6 of 14 | #9 of 59 | ↑ #6 |
| Elementary School Absenteeism | 30.5% | #8 of 14 | #20 of 59 | ↓ #8 |
| On-Time High School Graduation | 90.2% | #5 of 14 | #12 of 59 | ↑ #5 |
| Did Not Complete High School | 13.3% | #6 of 14 | #22 of 59 | ↓ #6 |
| High School Grad / Some College | 33.8% | #10 of 14 | #38 of 59 | ↑ #10 |
| College Degree or Higher | 52.8% | #5 of 14 | #16 of 59 | ↑ #5 |
| Poverty | 16.5% | #9 of 14 | #24 of 59 | ↓ #9 |
| Unemployment | 7.4% | #10 of 14 | #31 of 59 | ↓ #10 |
| Rent Burden | 45.0% | #3 of 14 | #13 of 59 | ↓ #3 |
| Avertable Deaths | 15.5 | #5 of 14 | #9 of 59 | ↓ #5 |
| Helpful Neighbors | 54.3% | #10 of 14 | #35 of 59 | ↑ #10 |
| Non-Fatal Assault Hospitalizations | 20.9 | #3 of 14 | #10 of 59 | ↓ #3 |
| Jail Incarceration | 112.6 | #6 of 14 | #20 of 59 | ↓ #6 |
| Air Conditioning | 94.9% | #3 of 14 | #12 of 59 | ↑ #3 |
| Air Pollution | 6.5 | #5 of 14 | #12 of 59 | ↓ #5 |
| Renter Homes with Health-Related Housing Problems | 65.0% | #11 of 14 | #34 of 59 | ↓ #11 |
| Homes Reporting Cockroaches | 41.7% | #12 of 14 | #43 of 59 | ↓ #12 |
| Ratio of Bodegas to Supermarkets | 5.1 | #5 of 14 | #8 of 59 | ↓ #5 |
| Farmers Markets | 1 | #4 of 14 | #44 of 59 | ↑ #4 |
| Bicycle Network Coverage | 14.1% | #6 of 14 | #41 of 59 | ↑ #6 |
| Pedestrian Injury Hospitalizations | 8.2 | #3 of 14 | #5 of 59 | ↓ #3 |
| Late or No Prenatal Care | 6.9% | #4 of 14 | #22 of 59 | ↓ #4 |
| Preterm Births | 8.8% | #4 of 14 | #19 of 59 | ↓ #4 |
| Teen Births | 2.8% | #2 of 14 | #8 of 59 | ↓ #2 |
| Childhood Obesity | 18.4% | #4 of 14 | #17 of 59 | ↓ #4 |
| Child Asthma Emergency Department Visits | 101.7 | #9 of 14 | #26 of 59 | ↓ #9 |
| Self-Reported Good Health | 86.0% | #6 of 14 | #17 of 59 | ↑ #6 |
| Physical Activity | 69.1% | #7 of 14 | #26 of 59 | ↑ #7 |
| Sugary Drink Consumption | 11.3% | #6 of 14 | #20 of 59 | ↓ #6 |
| Fruit and Vegetable Consumption | 92.0% | #2 of 14 | #13 of 59 | ↑ #2 |
| Current Smokers | 5.3% | #5 of 14 | #14 of 59 | ↓ #5 |
| Uninsured | 10.3% | #3 of 14 | #30 of 59 | ↓ #3 |
| Unmet Medical Care | 13.0% | #3 of 14 | #17 of 59 | ↓ #3 |
| Avoidable Hospitalizations Among Adults | 676.9 | #6 of 14 | #18 of 59 | ↓ #6 |
| Fall-Related Hospitalizations Among Older Adults | 1193.0 | #7 of 14 | #22 of 59 | ↓ #7 |
| Flu Vaccination | 51.8% | #3 of 14 | #19 of 59 | ↑ #3 |
| HPV Vaccination | 41.1% | #8 of 14 | #34 of 59 | ↑ #8 |
| Obesity | 28.5% | #10 of 14 | #32 of 59 | ↓ #10 |
| Diabetes | 16.9% | #12 of 14 | #49 of 59 | ↓ #12 |
| Hypertension | 28.3% | #8 of 14 | #27 of 59 | ↓ #8 |
| New HIV Diagnoses | 6.0 | #3 of 14 | #9 of 59 | ↓ #3 |
| New Hepatitis C Reports | 17.3 | #5 of 14 | #11 of 59 | ↓ #5 |
| Binge Drinking | 18.2% | #6 of 14 | #10 of 59 | ↓ #6 |
| Psychiatric Hospitalizations | 311.1 | #6 of 14 | #15 of 59 | ↓ #6 |
| Infant Mortality | 3.4 | #7 of 14 | #27 of 59 | ↓ #7 |
| Premature Mortality Number | 980 | #4 of 14 | #18 of 59 | ↓ #4 |
| Premature Mortality Rate | 132.4 | #5 of 14 | #13 of 59 | ↓ #5 |
| Life Expectancy | 85.1 years | #6 of 14 | #14 of 59 | ↑ #6 |