9
Queens Community Board 9
About This District
Queens Community District 9
Queens Community District 9 encompasses Woodhaven, Richmond Hill, Ozone Park, and Kew Gardens. Covering 3.1 square miles and home to more than 140,000 residents, it sits in central-southern Queens between Forest Park and the Brooklyn line.
The district includes commercial avenues, residential blocks, transit corridors, parks, and institutions that connect central and southern Queens, with a built environment that shifts from apartments to attached houses to older commercial strips.
Queens Community Board 9 — Interactive District Map
Open full map ↗2025 General Election Results
2025 NOVEMBER GENERAL ELECTION
QNCB9
QNCB9 — Mamdani won this CB district 53.5% to 37.3% for Cuomo and 9.2% for Sliwa, and carried 56 of 66 election districts here.
Mamdani won 56 of 66 election districts in QNCB9.
Winner
Mamdani by 16.2%
EDs carried
Mamdani: 56 of 66
Mamdani
53.5%
Cuomo
37.3%
Sliwa 9.2%
Mayor
Citywide: Mamdani 39/59 (66%) · Cuomo 20/59 (34%)
Q1 — Olympic Sports Complex
Citywide: NO 45/59 (76%) · YES 14/59 (24%)
Q2 — Fast Track Affordable Housing
Citywide: YES 46/59 (78%) · NO 13/59 (22%)
Q3 — Simplify Housing & Infrastructure Review
Citywide: YES 45/59 (76%) · NO 14/59 (24%)
Q4 — Affordable Housing Appeals Board
Citywide: YES 47/59 (80%) · NO 12/59 (20%)
Q5 — Digital City Map
Citywide: YES 55/59 (93%) · NO 4/59 (7%)
Q6 — Move Local Elections to Presidential Years
Citywide: NO 31/59 (53%) · YES 28/59 (47%)
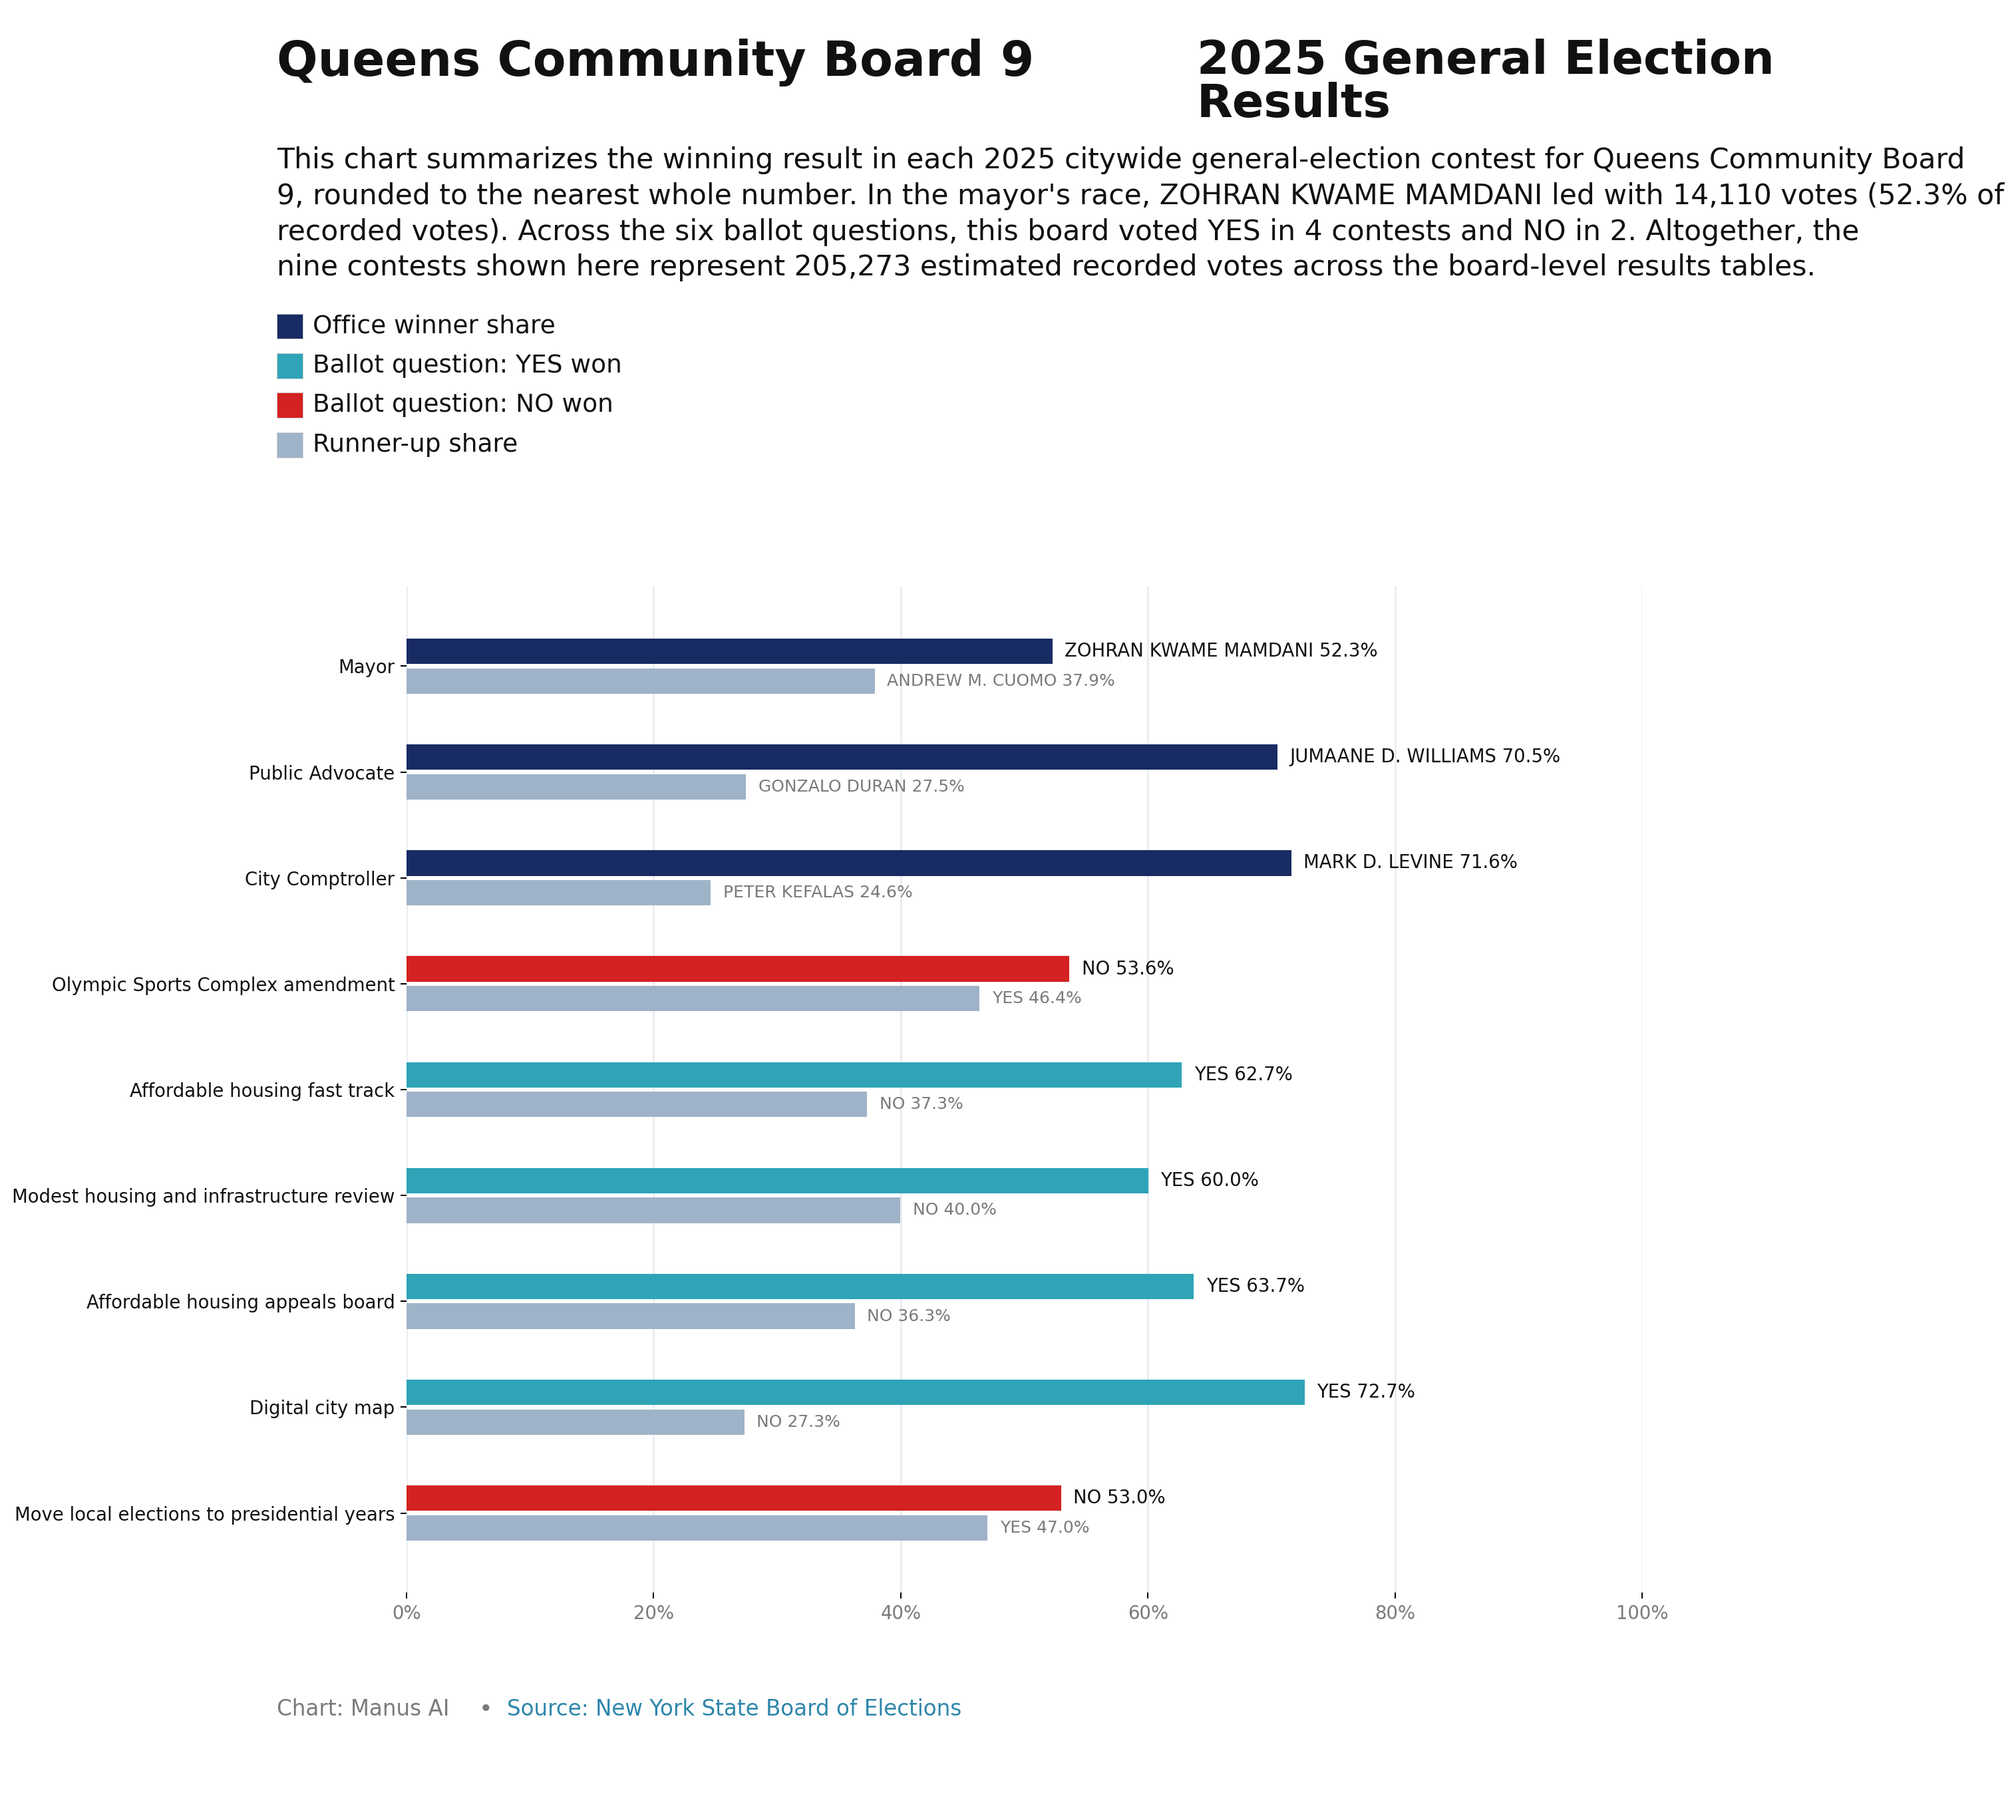
Queens CB9 — 2025 General Election Results
Community Health Profile
Kew Gardens and Woodhaven · Source: NYC DOHMH 2026 Community Health Profiles
Demographics
Total Population
145,464
Boro #10
NYC #30
Age 0–17
22.2%
Boro #2
NYC #17
Age 18–24
8.6%
Boro #4
NYC #29
Age 25–44
28.0%
Boro #7
NYC #33
Age 45–64
26.4%
Boro #7
NYC #11
Age 65+
14.8%
Boro #14
NYC #44
Asian
28.3%
Boro #7
NYC #10
Black
9.0%
Boro #7
NYC #34
Latino
41.5%
Boro #3
NYC #17
White
17.1%
Boro #10
NYC #39
Other race/ethnicity
4.1%
Boro #2
NYC #4
Limited English Proficiency
27.8%
Boro #7
NYC #16
Born Outside the US
51.8%
Boro #4
NYC #6
Education
Elementary School Absenteeism
35.3%
Boro #11
NYC #31
On-Time High School Graduation
89.1%
Boro #8
NYC #15
Did Not Complete High School
20.4%
Boro #10
NYC #40
High School Grad / Some College
41.2%
Boro #7
NYC #25
College Degree or Higher
38.4%
Boro #9
NYC #39
Economy
Poverty
16.4%
Boro #8
NYC #23
Unemployment
6.7%
Boro #6
NYC #21
Rent Burden
51.0%
Boro #8
NYC #33
Helpful Neighbors
52.5%
Boro #12
NYC #41
Jail Incarceration
141.7
Boro #10
NYC #27
Environment & Housing
Air Conditioning
91.9%
Boro #11
NYC #28
Air Pollution
6.7
Boro #8
NYC #21
Renter Housing Problems
39.1%
Boro #1
NYC #3
Homes Reporting Cockroaches
19.5%
Boro #4
NYC #13
Bodega:Supermarket Ratio
8.6
Boro #10
NYC #30
Farmers Markets
3
Boro #1
NYC #14
Bike Network Coverage
1.6%
Boro #13
NYC #58
Non-Fatal Assault Hospitalizations
31.1
Boro #7
NYC #25
Maternal & Child Health
Late or No Prenatal Care
8.2%
Boro #7
NYC #27
Preterm Births
11.7%
Boro #11
NYC #50
Teen Births
10.1%
Boro #10
NYC #34
Childhood Obesity
24.9%
Boro #10
NYC #36
Child Asthma ED Visits
92.2
Boro #8
NYC #21
Health Behaviors
Self-Reported Good Health
86.3%
Boro #5
NYC #16
Physical Activity
69.7%
Boro #6
NYC #25
Sugary Drink Consumption
16.3%
Boro #8
NYC #34
Fruit and Vegetable Consumption
88.2%
Boro #8
NYC #30
Current Smokers
5.2%
Boro #4
NYC #13
Binge Drinking
27.5%
Boro #12
NYC #40
Obesity
27.1%
Boro #9
NYC #29
Healthcare Access
Uninsured
14.1%
Boro #9
NYC #49
Unmet Medical Care
19.3%
Boro #13
NYC #46
Flu Vaccination
44.5%
Boro #11
NYC #42
HPV Vaccination
46.0%
Boro #5
NYC #26
Disease & Mortality
Avoidable Hospitalizations
957.9
Boro #10
NYC #31
Fall Hospitalizations
1420.1
Boro #11
NYC #34
Diabetes
15.7%
Boro #11
NYC #44
Hypertension
24.1%
Boro #1
NYC #10
New HIV Diagnoses
12.8
Boro #7
NYC #24
New Hepatitis C Reports
39.2
Boro #14
NYC #45
Psychiatric Hospitalizations
484.6
Boro #10
NYC #35
Infant Mortality
5.4
Boro #11
NYC #43
Premature Mortality Number
1,282
Boro #6
NYC #29
Premature Mortality Rate
180.0
Boro #11
NYC #30
Life Expectancy
83.0 years
Boro #9
NYC #26
▼ Full data table (all 58 indicators)
| Indicator | Value | Boro Rank | NYC Rank | Rank |
|---|---|---|---|---|
| Total Population | 145,464 | #10 of 14 | #30 of 59 | ↑ #10 |
| Age 0–17 | 22.2% | #2 of 14 | #17 of 59 | ↑ #2 |
| Age 18–24 | 8.6% | #4 of 14 | #29 of 59 | ↑ #4 |
| Age 25–44 | 28.0% | #7 of 14 | #33 of 59 | ↑ #7 |
| Age 45–64 | 26.4% | #7 of 14 | #11 of 59 | ↑ #7 |
| Age 65+ | 14.8% | #14 of 14 | #44 of 59 | ↑ #14 |
| Asian | 28.3% | #7 of 14 | #10 of 59 | ↑ #7 |
| Black | 9.0% | #7 of 14 | #34 of 59 | ↑ #7 |
| Latino | 41.5% | #3 of 14 | #17 of 59 | ↑ #3 |
| White | 17.1% | #10 of 14 | #39 of 59 | ↑ #10 |
| Other race/ethnicity | 4.1% | #2 of 14 | #4 of 59 | ↑ #2 |
| Limited English Proficiency | 27.8% | #7 of 14 | #16 of 59 | ↑ #7 |
| Born Outside the US | 51.8% | #4 of 14 | #6 of 59 | ↑ #4 |
| Elementary School Absenteeism | 35.3% | #11 of 14 | #31 of 59 | ↓ #11 |
| On-Time High School Graduation | 89.1% | #8 of 14 | #15 of 59 | ↑ #8 |
| Did Not Complete High School | 20.4% | #10 of 14 | #40 of 59 | ↓ #10 |
| High School Grad / Some College | 41.2% | #7 of 14 | #25 of 59 | ↑ #7 |
| College Degree or Higher | 38.4% | #9 of 14 | #39 of 59 | ↑ #9 |
| Poverty | 16.4% | #8 of 14 | #23 of 59 | ↓ #8 |
| Unemployment | 6.7% | #6 of 14 | #21 of 59 | ↓ #6 |
| Rent Burden | 51.0% | #8 of 14 | #33 of 59 | ↓ #8 |
| Avertable Deaths | 32.5 | #10 of 14 | #25 of 59 | ↓ #10 |
| Helpful Neighbors | 52.5% | #12 of 14 | #41 of 59 | ↑ #12 |
| Non-Fatal Assault Hospitalizations | 31.1 | #7 of 14 | #25 of 59 | ↓ #7 |
| Jail Incarceration | 141.7 | #10 of 14 | #27 of 59 | ↓ #10 |
| Air Conditioning | 91.9% | #11 of 14 | #28 of 59 | ↑ #11 |
| Air Pollution | 6.7 | #8 of 14 | #21 of 59 | ↓ #8 |
| Renter Homes with Health-Related Housing Problems | 39.1% | #1 of 14 | #3 of 59 | ↓ #1 |
| Homes Reporting Cockroaches | 19.5% | #4 of 14 | #13 of 59 | ↓ #4 |
| Ratio of Bodegas to Supermarkets | 8.6 | #10 of 14 | #30 of 59 | ↓ #10 |
| Farmers Markets | 3 | #1 of 14 | #14 of 59 | ↑ #1 |
| Bicycle Network Coverage | 1.6% | #13 of 14 | #58 of 59 | ↑ #13 |
| Pedestrian Injury Hospitalizations | 15.2 | #9 of 14 | #29 of 59 | ↓ #9 |
| Late or No Prenatal Care | 8.2% | #7 of 14 | #27 of 59 | ↓ #7 |
| Preterm Births | 11.7% | #11 of 14 | #50 of 59 | ↓ #11 |
| Teen Births | 10.1% | #10 of 14 | #34 of 59 | ↓ #10 |
| Childhood Obesity | 24.9% | #10 of 14 | #36 of 59 | ↓ #10 |
| Child Asthma Emergency Department Visits | 92.2 | #8 of 14 | #21 of 59 | ↓ #8 |
| Self-Reported Good Health | 86.3% | #5 of 14 | #16 of 59 | ↑ #5 |
| Physical Activity | 69.7% | #6 of 14 | #25 of 59 | ↑ #6 |
| Sugary Drink Consumption | 16.3% | #8 of 14 | #34 of 59 | ↓ #8 |
| Fruit and Vegetable Consumption | 88.2% | #8 of 14 | #30 of 59 | ↑ #8 |
| Current Smokers | 5.2% | #4 of 14 | #13 of 59 | ↓ #4 |
| Uninsured | 14.1% | #9 of 14 | #49 of 59 | ↓ #9 |
| Unmet Medical Care | 19.3% | #13 of 14 | #46 of 59 | ↓ #13 |
| Avoidable Hospitalizations Among Adults | 957.9 | #10 of 14 | #31 of 59 | ↓ #10 |
| Fall-Related Hospitalizations Among Older Adults | 1420.1 | #11 of 14 | #34 of 59 | ↓ #11 |
| Flu Vaccination | 44.5% | #11 of 14 | #42 of 59 | ↑ #11 |
| HPV Vaccination | 46.0% | #5 of 14 | #26 of 59 | ↑ #5 |
| Obesity | 27.1% | #9 of 14 | #29 of 59 | ↓ #9 |
| Diabetes | 15.7% | #11 of 14 | #44 of 59 | ↓ #11 |
| Hypertension | 24.1% | #1 of 14 | #10 of 59 | ↓ #1 |
| New HIV Diagnoses | 12.8 | #7 of 14 | #24 of 59 | ↓ #7 |
| New Hepatitis C Reports | 39.2 | #14 of 14 | #45 of 59 | ↓ #14 |
| Binge Drinking | 27.5% | #12 of 14 | #40 of 59 | ↓ #12 |
| Psychiatric Hospitalizations | 484.6 | #10 of 14 | #35 of 59 | ↓ #10 |
| Infant Mortality | 5.4 | #11 of 14 | #43 of 59 | ↓ #11 |
| Premature Mortality Number | 1,282 | #6 of 14 | #29 of 59 | ↓ #6 |
| Premature Mortality Rate | 180.0 | #11 of 14 | #30 of 59 | ↓ #11 |
| Life Expectancy | 83.0 years | #9 of 14 | #26 of 59 | ↑ #9 |