Where the numbers come from. DSNY Monthly Tonnage Data, NYC Open Data dataset ebb7-mvp5, downloaded 27 August 2026. Every month, every community district, back to January 1990. Nothing here is modeled or estimated. The tonnages are the City's own.
What it counts, and what it does not. This is what DSNY itself collects: residential buildings, public schools, and City institutions. It is not all the garbage in your district. Commercial waste from stores, offices, restaurants and bars is hauled by private carting companies and does not appear in this dataset at all. Districts with large business corridors therefore look lighter than they are.
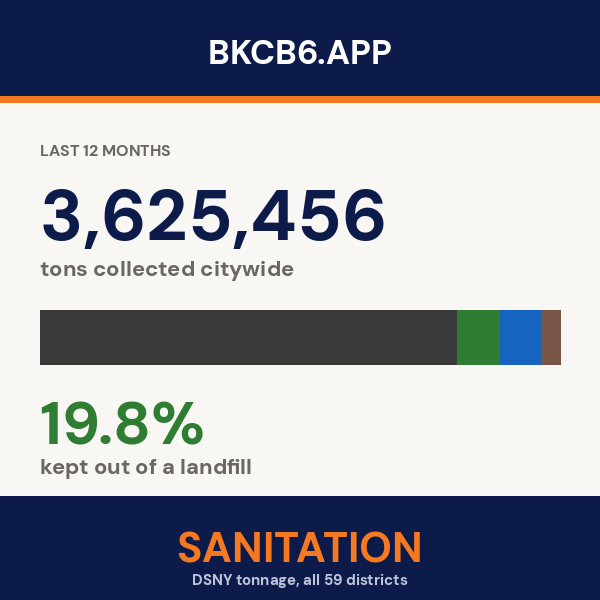
The four streams. Refuse is the black bag, headed for landfill or export. Paper and cardboard go in the green bin. Metal, glass, plastic and cartons go in the blue bin. Organics, the brown bin, combines curbside residential composting with school organics, leaf collection and Christmas trees.
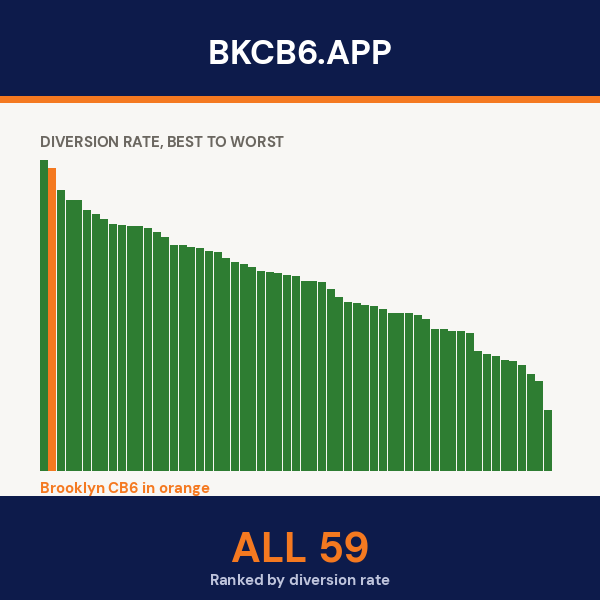
Diversion rate. Recycling plus organics, divided by everything collected. It is the single number that says how much of a district's waste stayed out of a landfill. Citywide it is under 20 percent.
Organics is not a fair comparison across all years. Curbside composting was suspended entirely from May 2020 to October 2021, and it reached the five boroughs on a staggered schedule, Queens first. A district's organics tonnage reflects when the program arrived as much as what residents do with their food scraps. Compare recent years, not the whole record.
Rates per resident. Pounds per resident per week uses the 2010 Decennial Census by community district, the most recent population the City publishes at this level. Districts that grew since read high, and districts with a lot of daytime population read high, because the rate counts residents only.
DSNY districts and community districts are the same lines. All 59 match one to one. DSNY adds its own operational grouping on top: Brooklyn is split into Brooklyn North and Brooklyn South, Queens into Queens East and Queens West. CB6 is district BKS06, in Brooklyn South.
Boundaries and garages. DSNY District Boundaries and DSNY Garages, both from NYC Open Data, downloaded 27 August 2026. Boundaries are simplified for drawing speed; garage points are as published.