Where the numbers come from. Two City datasets stitched together: 76ig-c548 covers 2010 through 2019, erm2-nwe9 covers 2020 to present. Roughly 44.8 million service requests.
Nothing is sampled. Every count is checked against the City's own total for the same filter and period before it is shown. If the two disagree, the page displays nothing rather than a partial figure.
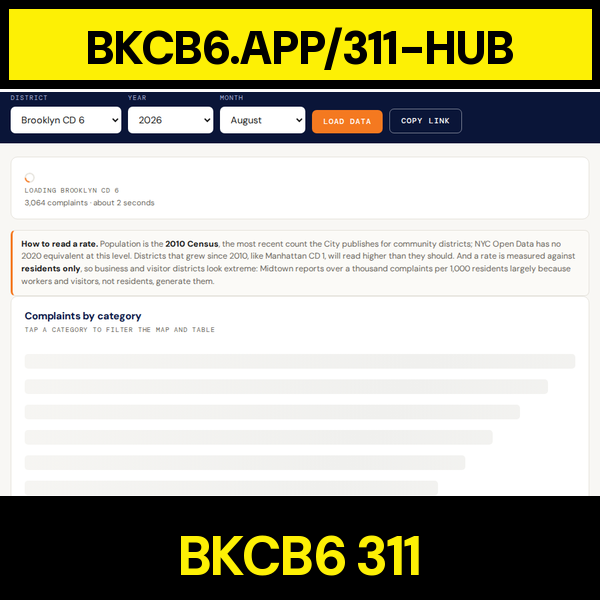
Complete takes time. A full year for a large district is over 100,000 records. Pages state the size and expected wait before starting, and offer a narrower option.
Categories. Report types are grouped into ten buckets consistent from 2010 forward, including retired names like NONCONST and Sanitation Condition, so old and new years compare.
Rates. Per-1,000 figures use the 2010 Census, the most recent population the City publishes by community district. Districts that grew since read high, and business districts read very high because the rate counts residents only.
Coordinates. Some reports are published without a location. They are counted in every total and listed in every table; they cannot be drawn on a map, and each map says how many.